Monitored Dashboards
Dashboard monitoring is available on the Pro plan and above (see Plans Comparison).
Per-dashboard monitoring tracks query performance, detects errors and slow queries, and sends email alerts, so you can maintain a great experience for your dashboard users.
Dashboard monitoring builds on top of the Datasource Performance & Insights feature by scoping metrics to the specific queries used by a dashboard, including both report queries and filter queries.
The same tab also carries the dashboard's usage — who has been opening it, and how often — which needs no monitoring to be enabled.
Enabling Monitoring
To enable monitoring for a dashboard, open the dashboard settings and navigate to the Monitoring tab.
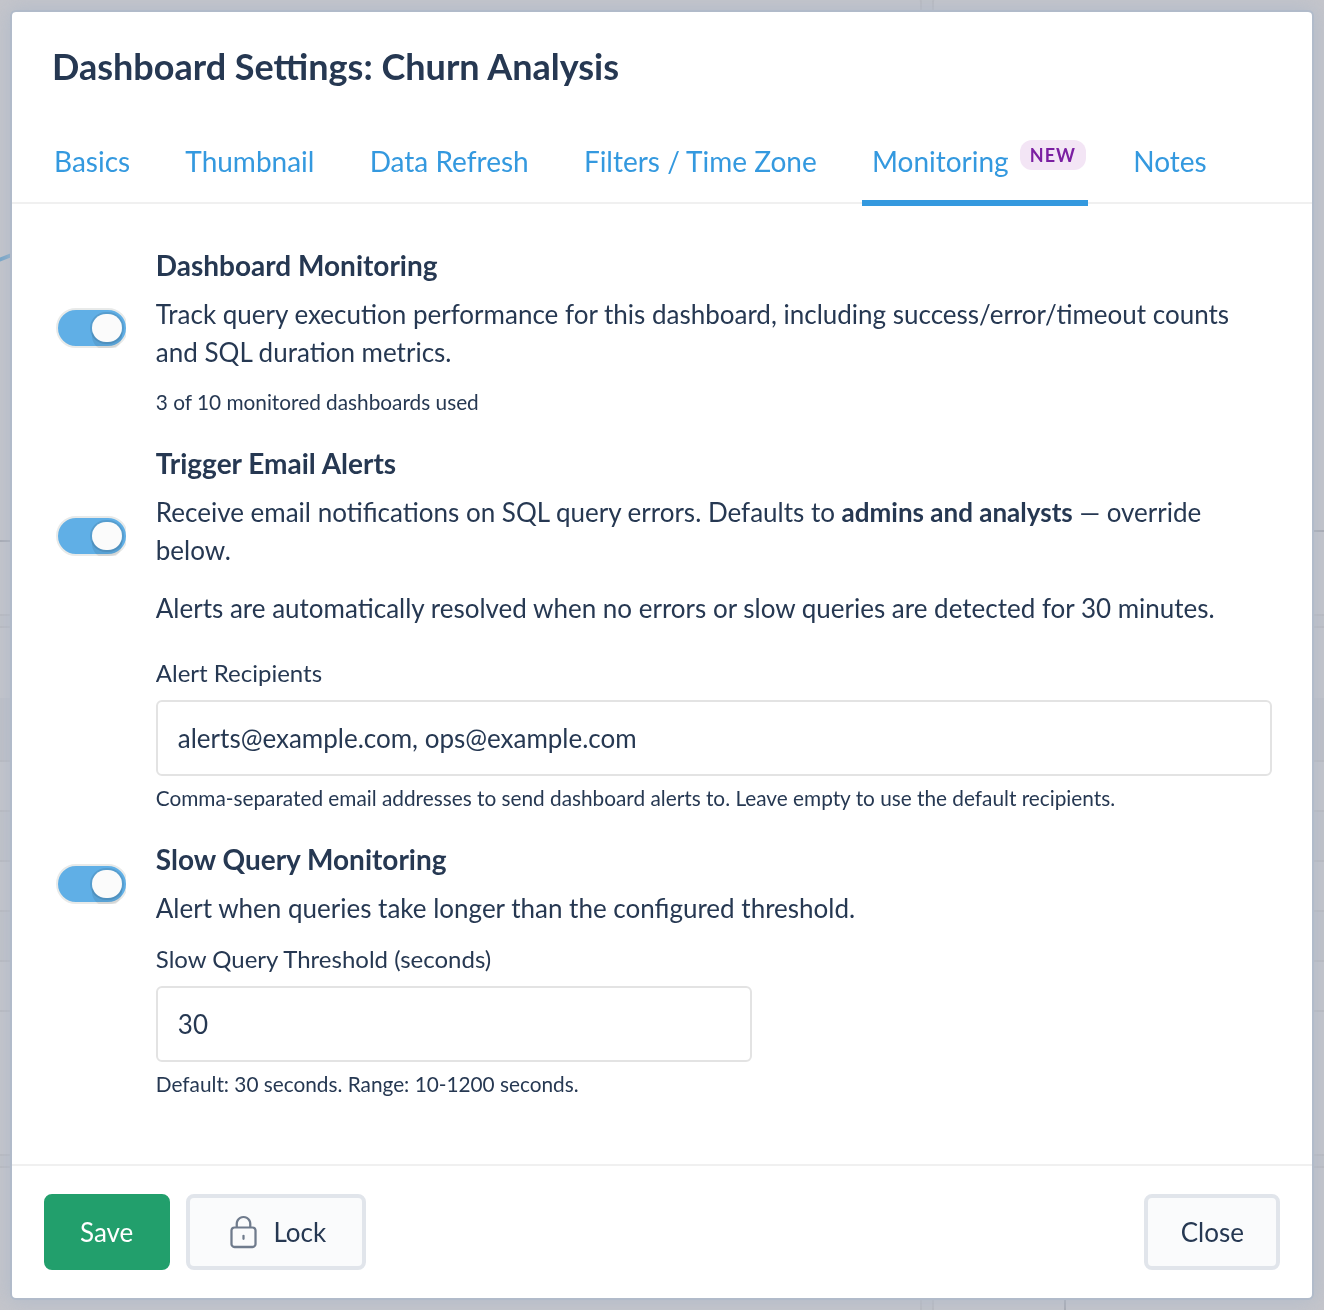
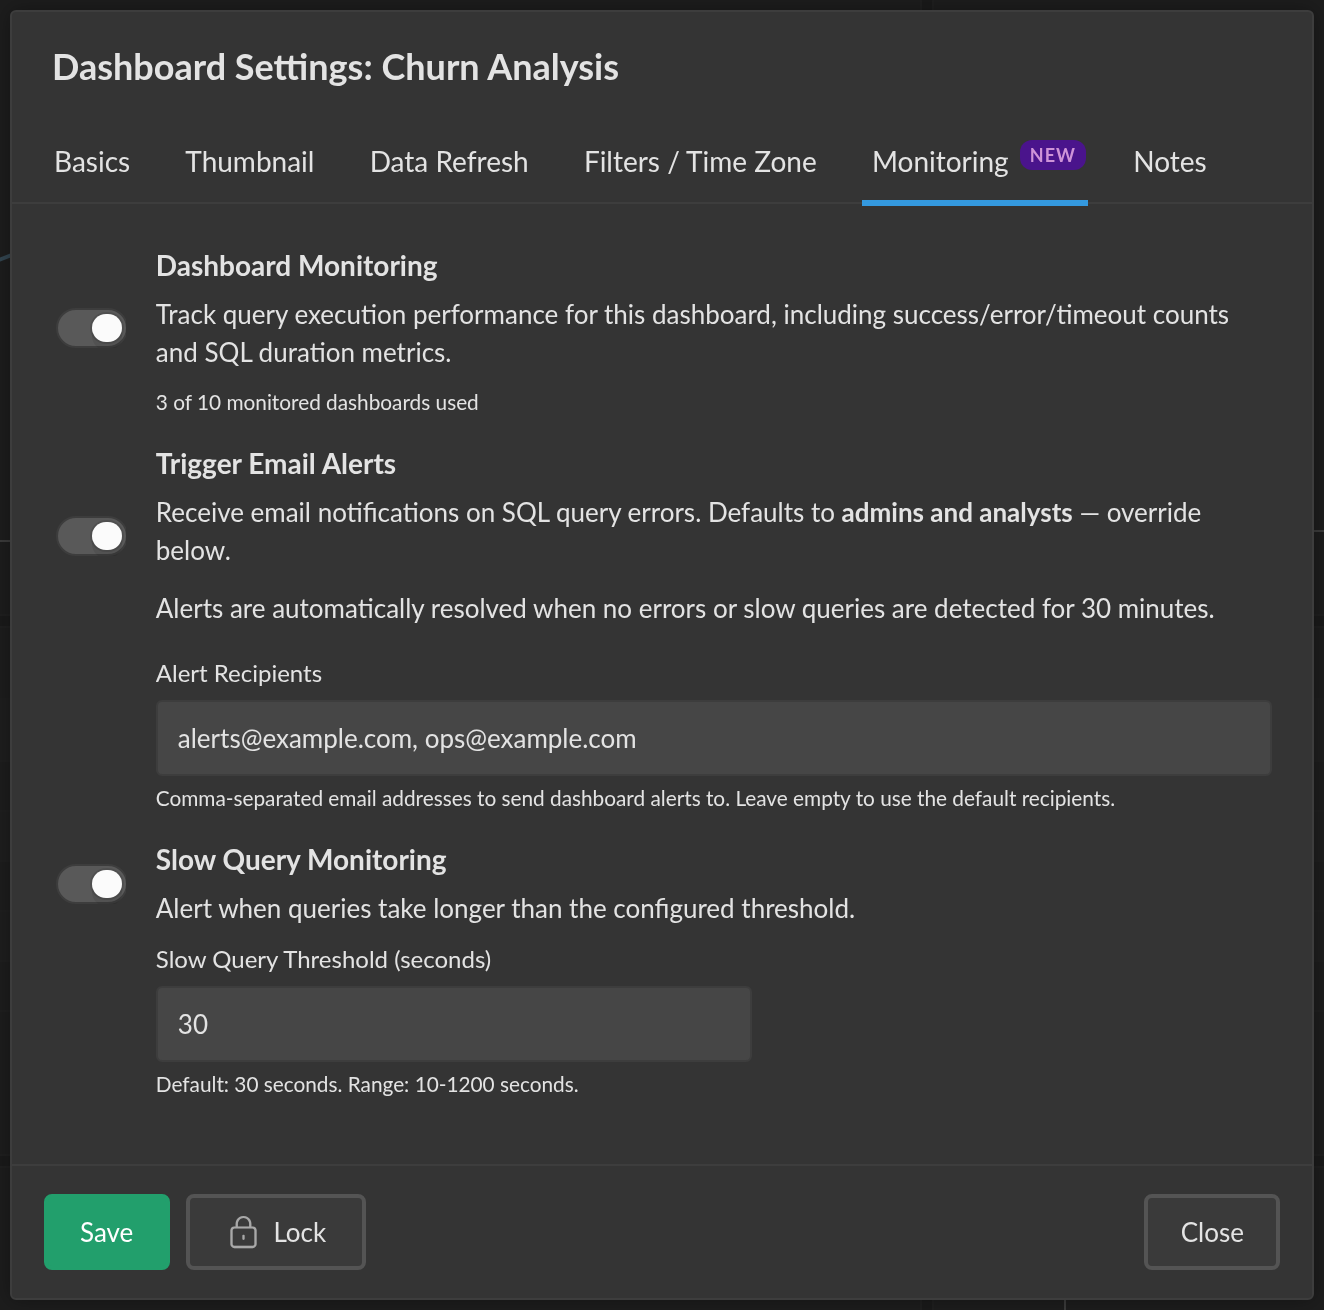
The Monitoring tab has three settings:
-
Dashboard Monitoring — The main toggle that enables collection of execution activity data (success/error/timeout counts, query durations) for the dashboard's queries. This data powers the Performance & Insights charts.
-
Trigger Email Alerts — When enabled, query errors and slow queries trigger email notifications. For published dashboards, all admins and analysts in the organization receive the alerts. For draft dashboards, only the dashboard owner receives them. Alerts are automatically resolved when no errors or slow queries are detected for 30 minutes and at least one successful query execution has occurred.
-
Slow Query Monitoring — When enabled, queries that exceed the configured threshold (in seconds) are flagged as slow queries. The default threshold is 30 seconds and can be adjusted between 10 and 1200 seconds (20 minutes).
Each organization can monitor up to 2 dashboards on the Pro plan and up to 10 dashboards on the Business plan. Enterprise plans have no limit.
Performance & Insights
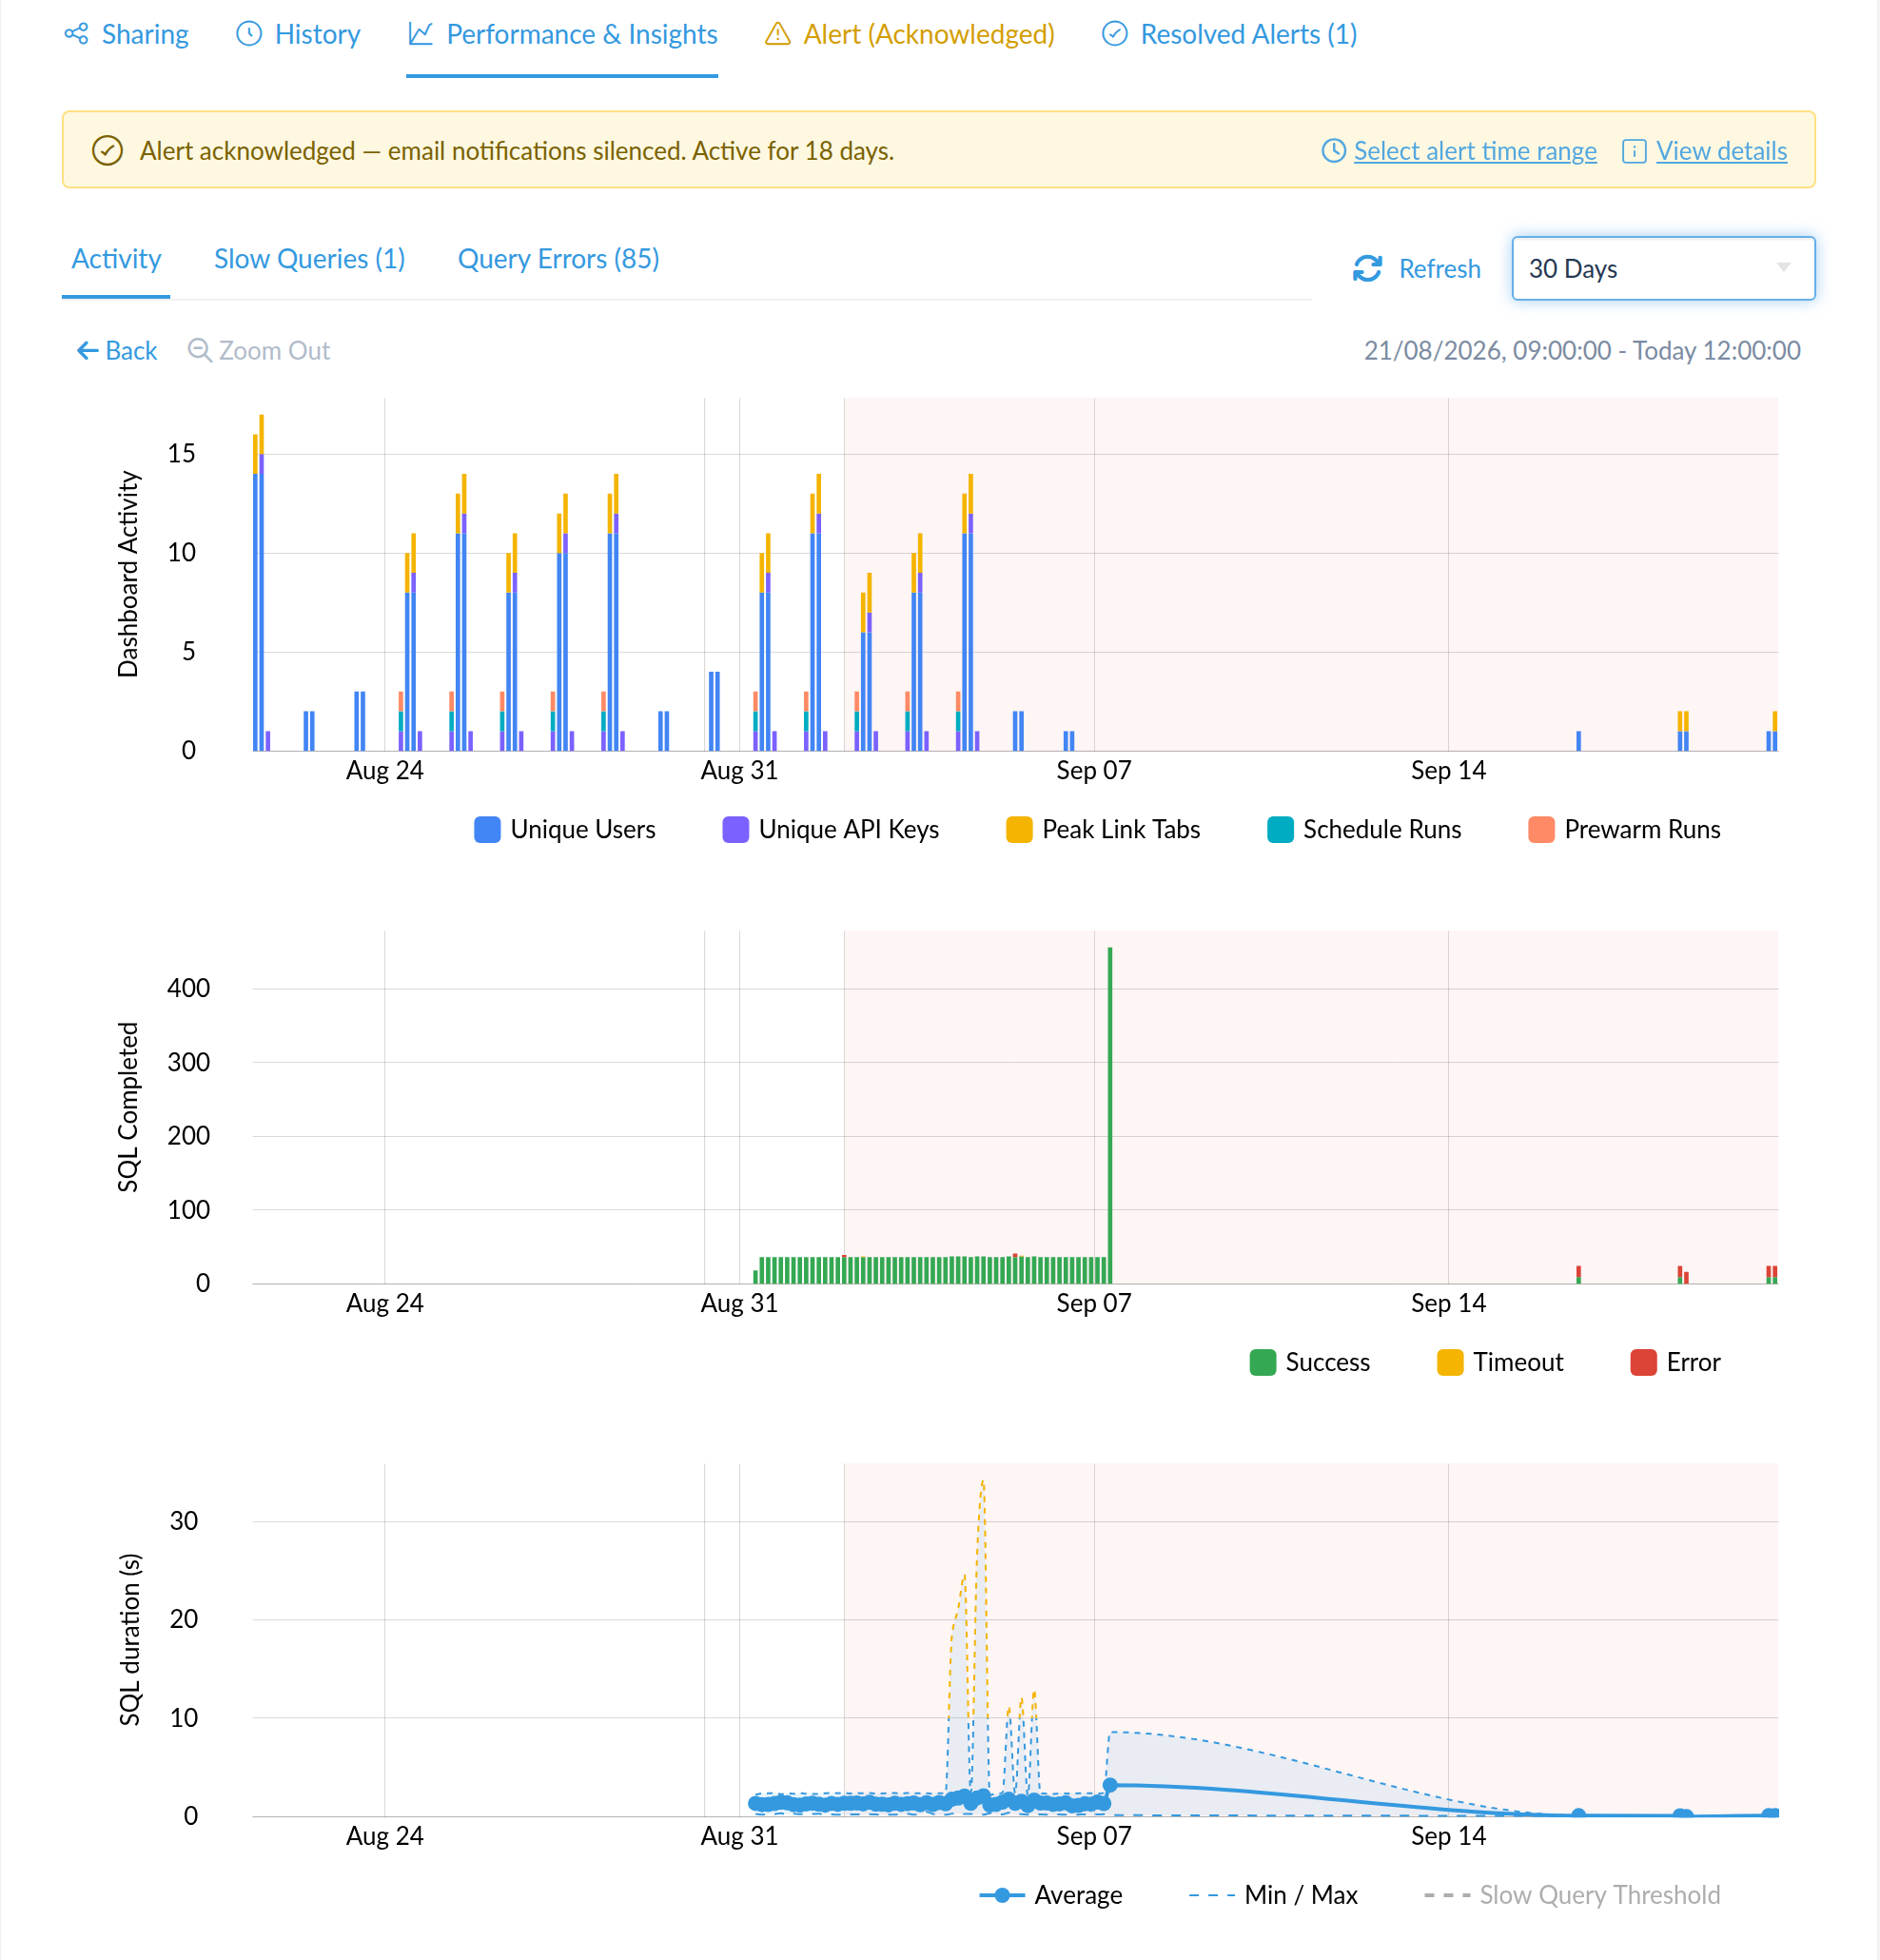
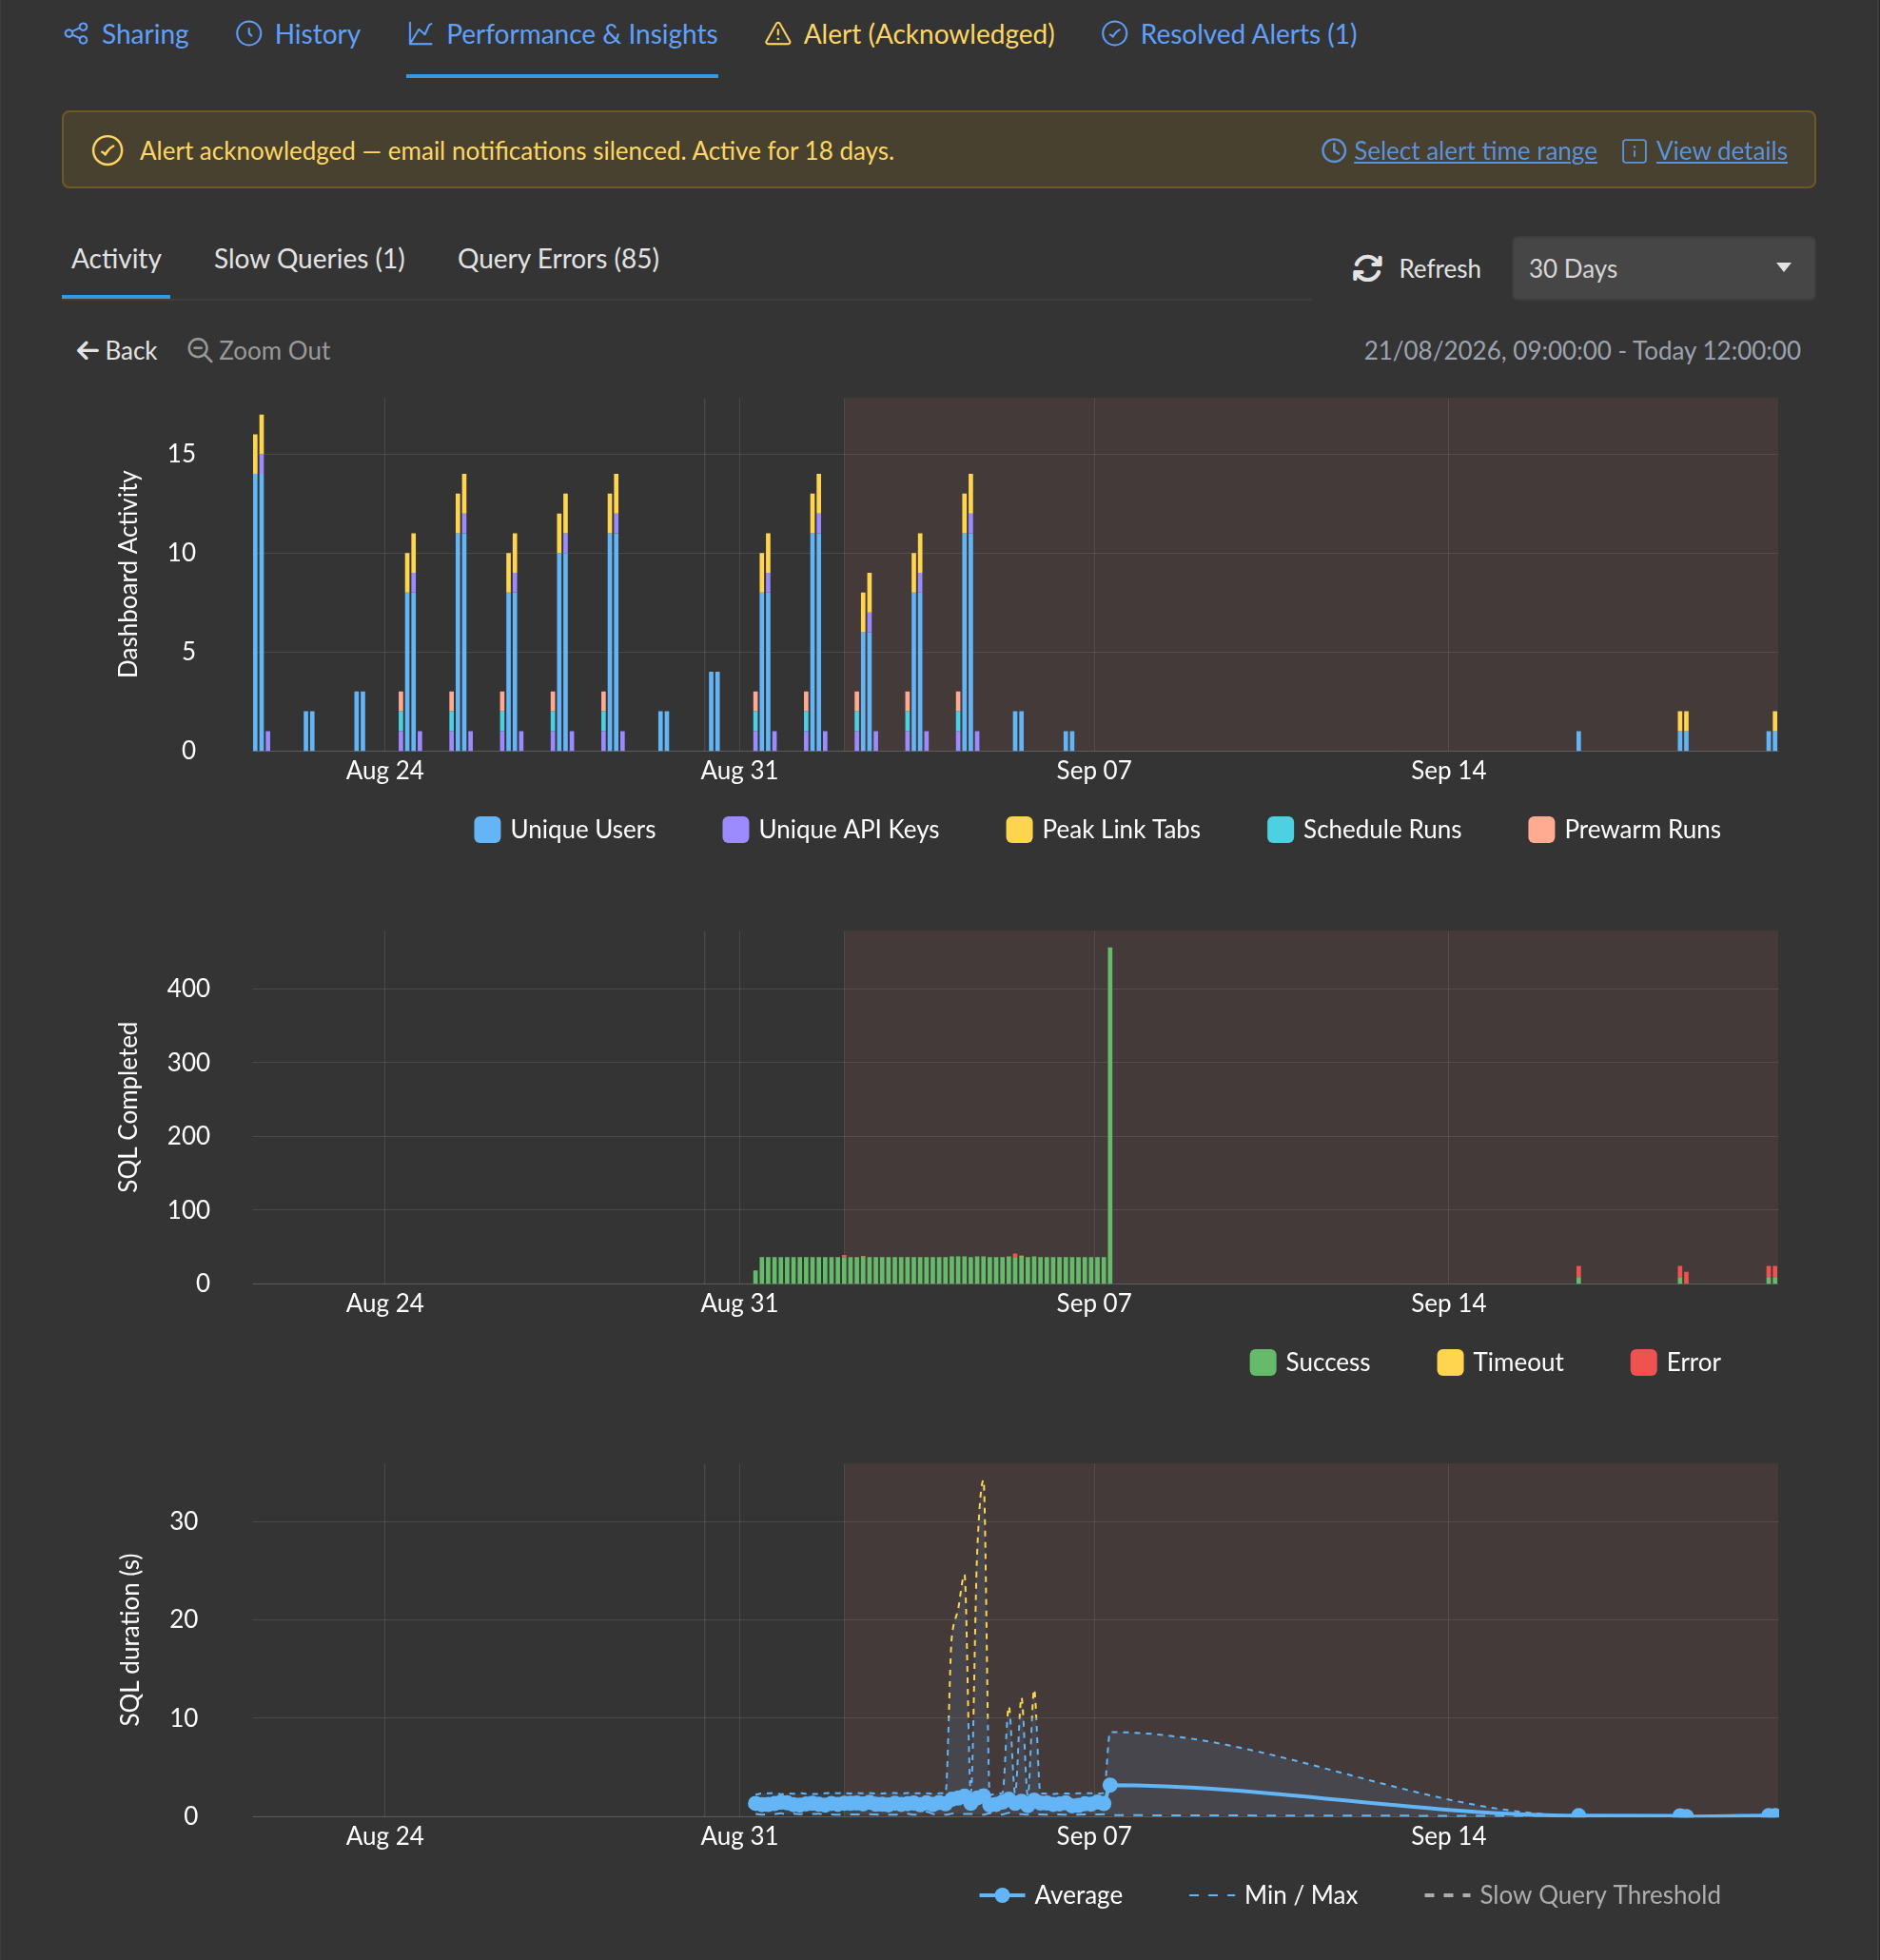
The Performance & Insights tab on the dashboard card shows activity charts and query metrics scoped to the dashboard's queries.
You can access Performance & Insights from:
- The Manage Sharing page for a dashboard (Settings > Dashboards > select a dashboard)
- The Performance & Insights link in the dashboard dropdown menu
- The dashboard list in Settings, by clicking on a monitoring status badge
Activity Tab
The Activity tab shows three charts:
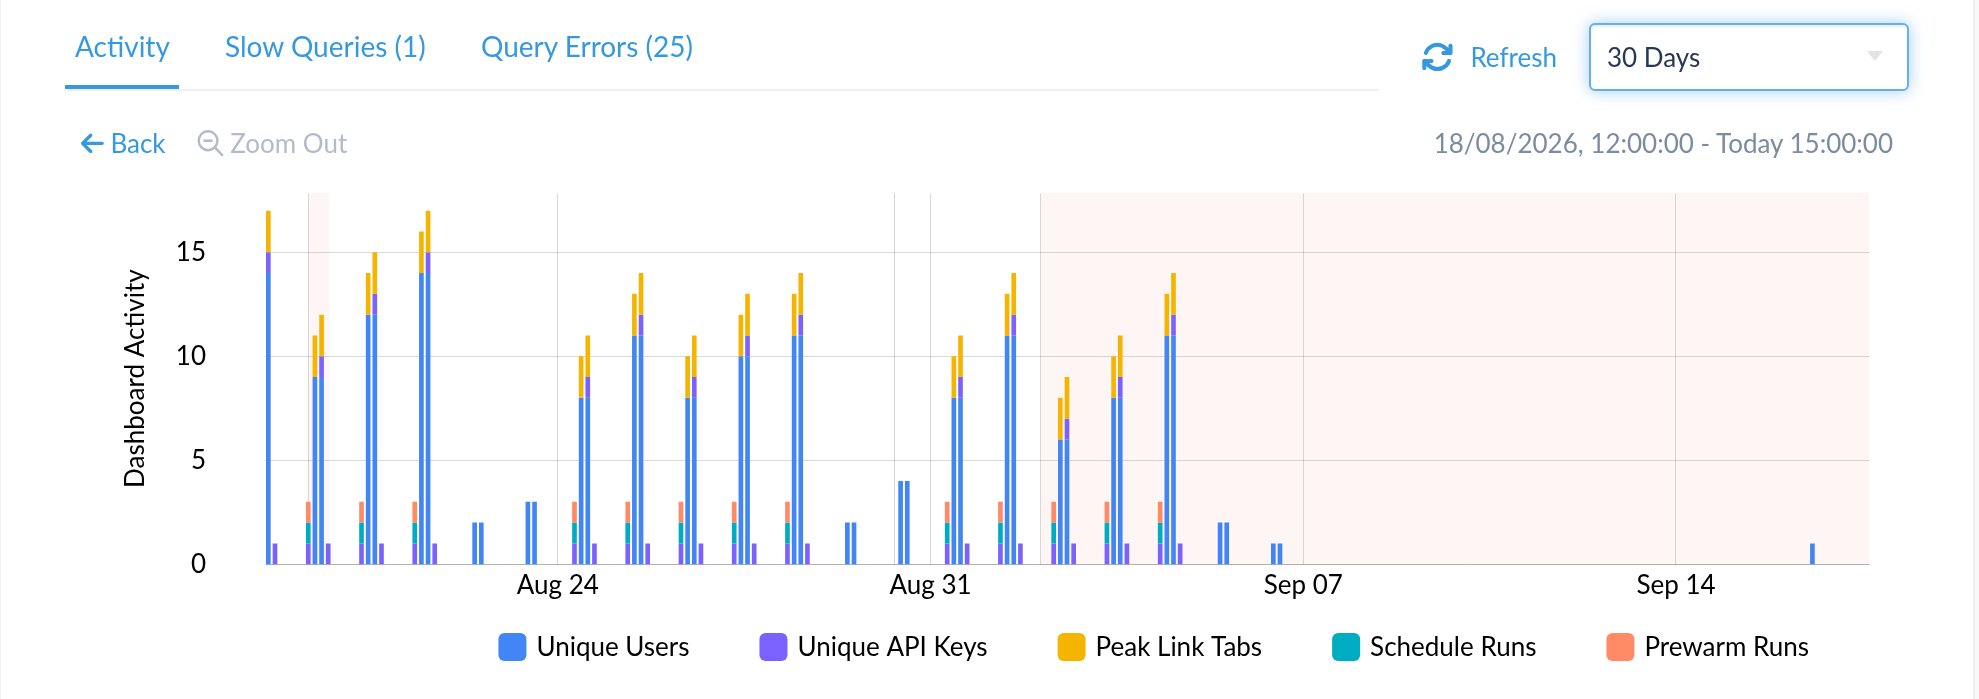
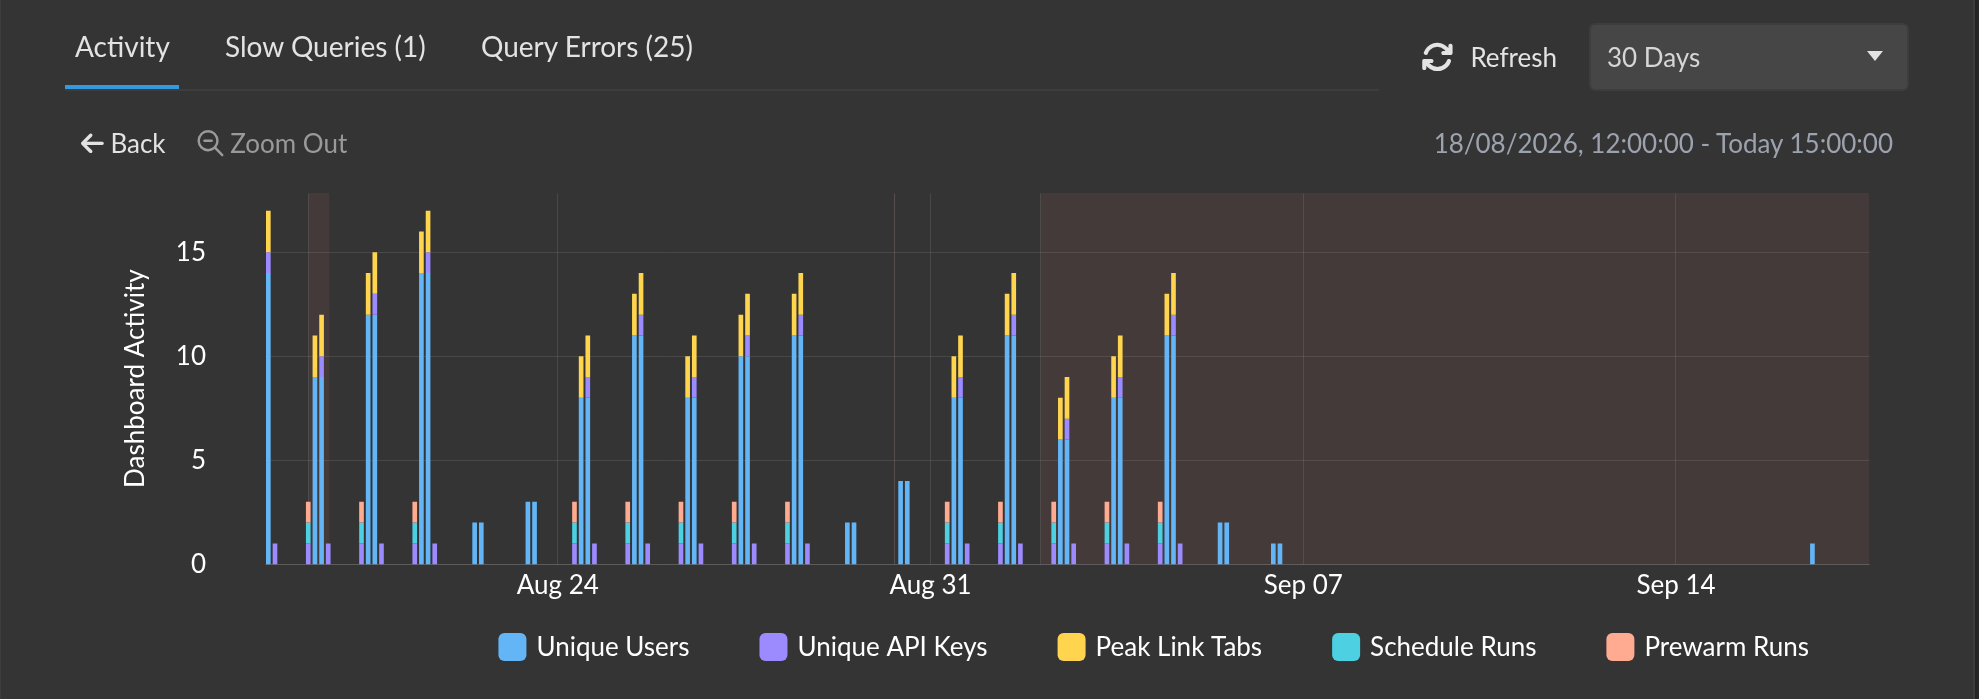
- Dashboard Access — Shows how many unique users, API keys, and sharing link tabs accessed the dashboard over time, along with scheduled refresh and prewarm events.
-
SQL Completed — Shows the number of completed query executions, color-coded by result: success (green), error (red), and timeout (orange).
-
SQL Duration — Shows minimum, average, and maximum SQL query durations, color-coded by speed.
Use the time range selector to switch between predefined ranges (30 minutes to 30 days) or click and drag on a chart to zoom into a specific time period. The 30-minute and 1-hour ranges update automatically as new data arrives.
Slow Queries Tab
When slow query monitoring is enabled, the Slow Queries tab shows all queries that exceeded the configured duration threshold in the selected time range.
The tab works identically to the Datasource Slow Queries view, but filtered to only the queries belonging to this dashboard. Click on a query to see its details, or use Group Same SQL & Filters to identify recurring slow query patterns.
Query Errors Tab
The Query Errors tab shows all query failures in the selected time range. Like slow queries, this view is filtered to the dashboard's own queries.
Click on an error to see the full details including the executed SQL, parameters, and other affected objects. Use Group Same Error Message to identify the most frequent errors.
Email Alerts
When email alerts are enabled, a query error or slow query on the dashboard triggers a notification.
Notification Schedule
Alert emails follow an escalating backoff schedule to avoid flooding your inbox:
| Notifications | Interval |
|---|---|
| 1-3 | Every 5 minutes |
| 4-7 | Every 1 hour |
| 8+ | Every 24 hours |
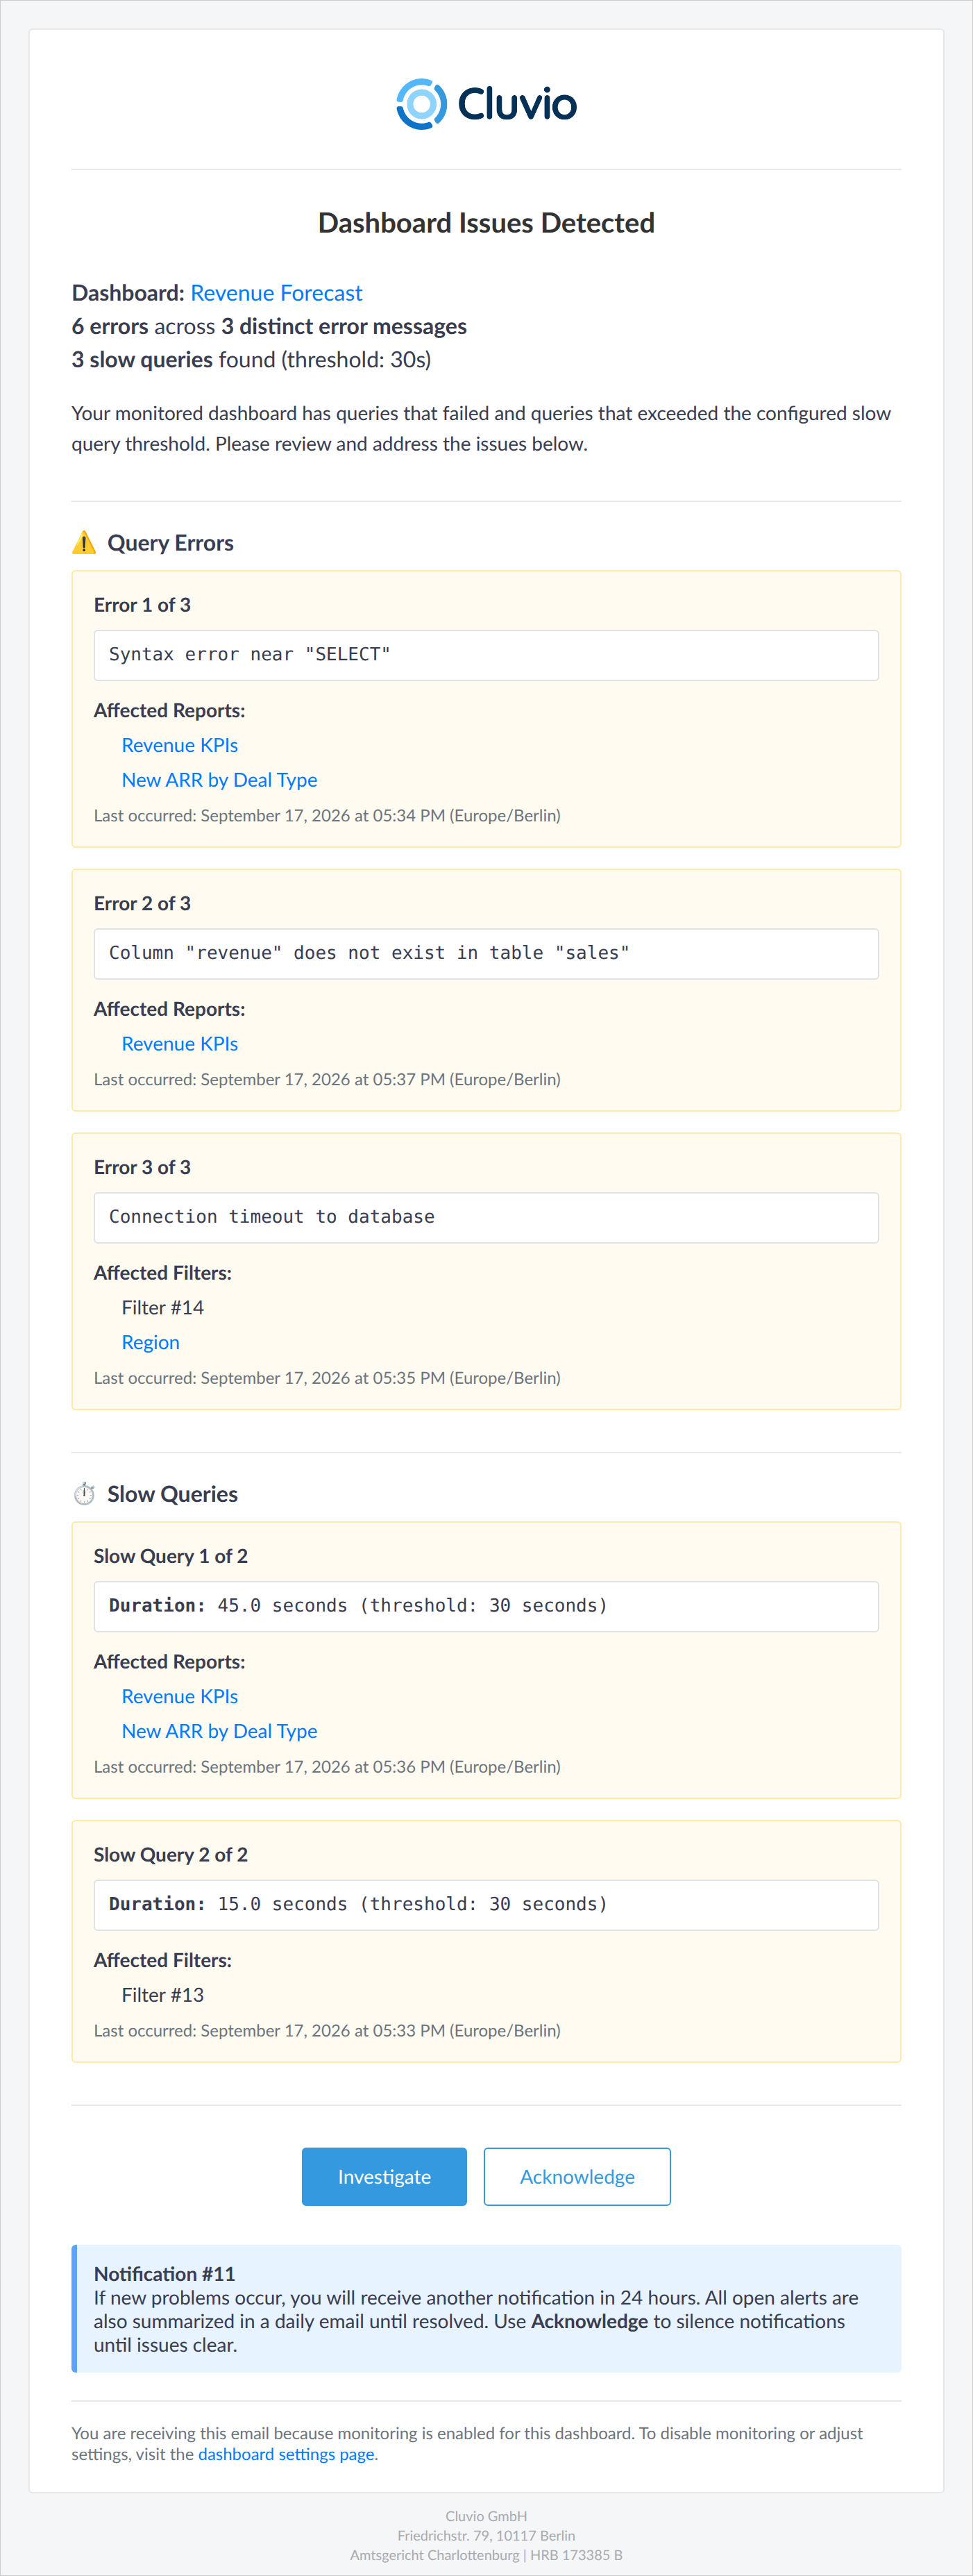
Each alert email includes:
- A summary of the errors and/or slow queries detected
- The affected reports and filters
- An Investigate button that opens Performance & Insights with the alert time range pre-selected
- An Acknowledge button to silence further notifications
Alert Lifecycle
Alerts go through the following states:
-
Active — An alert is created when the first error or slow query is detected. The first notification email is sent immediately.
-
Acknowledged — Click Acknowledge to silence email notifications while you investigate. The alert stays active but no further emails are sent. You can Unacknowledge at any time to resume notifications.
-
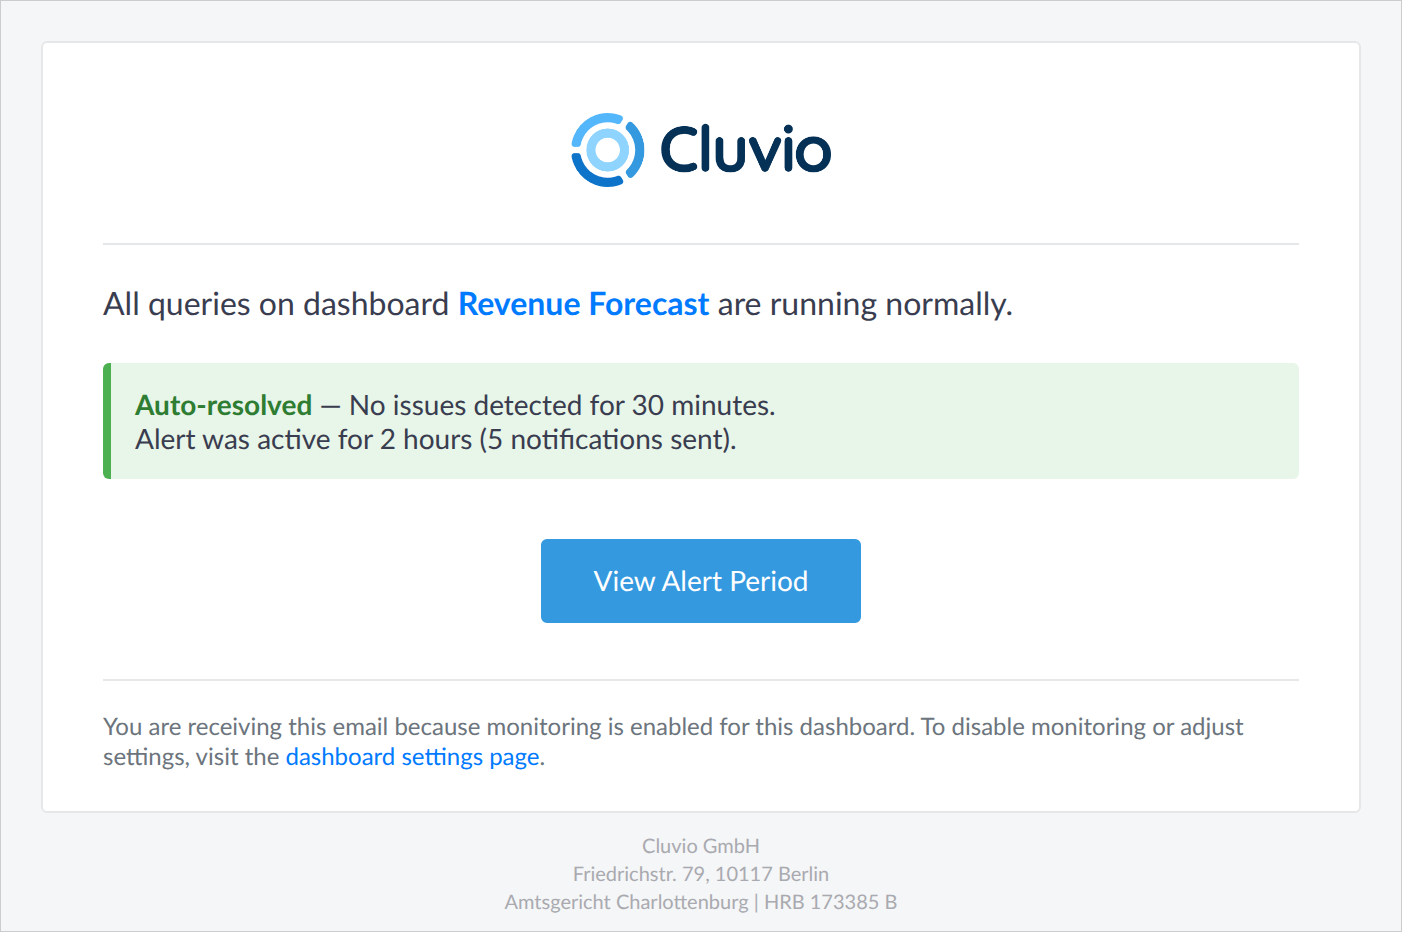
Auto-resolved — When no errors or slow queries are detected for 30 minutes and at least one successful query execution has occurred, the alert is automatically resolved. A resolved notification email is sent.
-
Manually resolved — Click Resolve to clear the alert manually. This also clears the notification history and resets the backoff schedule.
-
Reopened — If an auto-resolved alert recurs within 2 hours, the same alert is reopened rather than creating a new one. A reopened notification email is sent, and the backoff schedule continues from where it left off.
Disabling email alerts or monitoring on a dashboard automatically resolves any active alert.
Alert Badge
When a dashboard has an active alert, an Alert badge appears in the dashboard's header on its monitoring card, next to the Published / Draft badge.
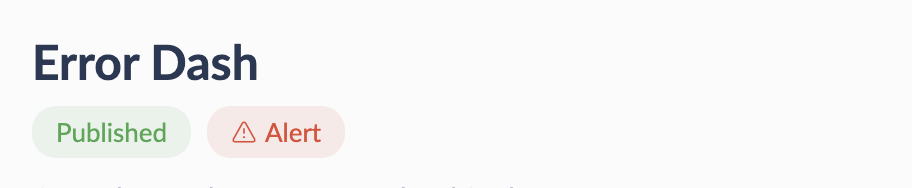
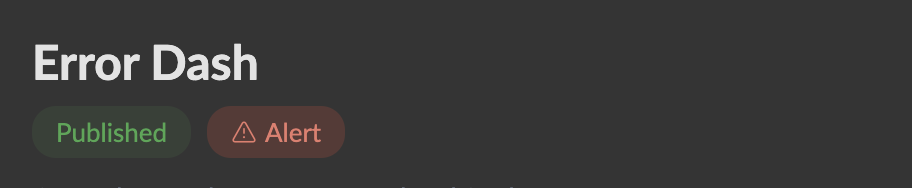
- A red badge indicates an active, unacknowledged alert
- A yellow badge indicates an acknowledged alert
Click the badge to open the dashboard's Alert tab, where you can review the affected reports and acknowledge or resolve the alert.
The badge updates automatically as the dashboard's monitoring status is polled, and disappears when the alert is resolved.
Alerts Log
The Alerts tab on the dashboard card shows a history of all alert incidents from the last 30 days.
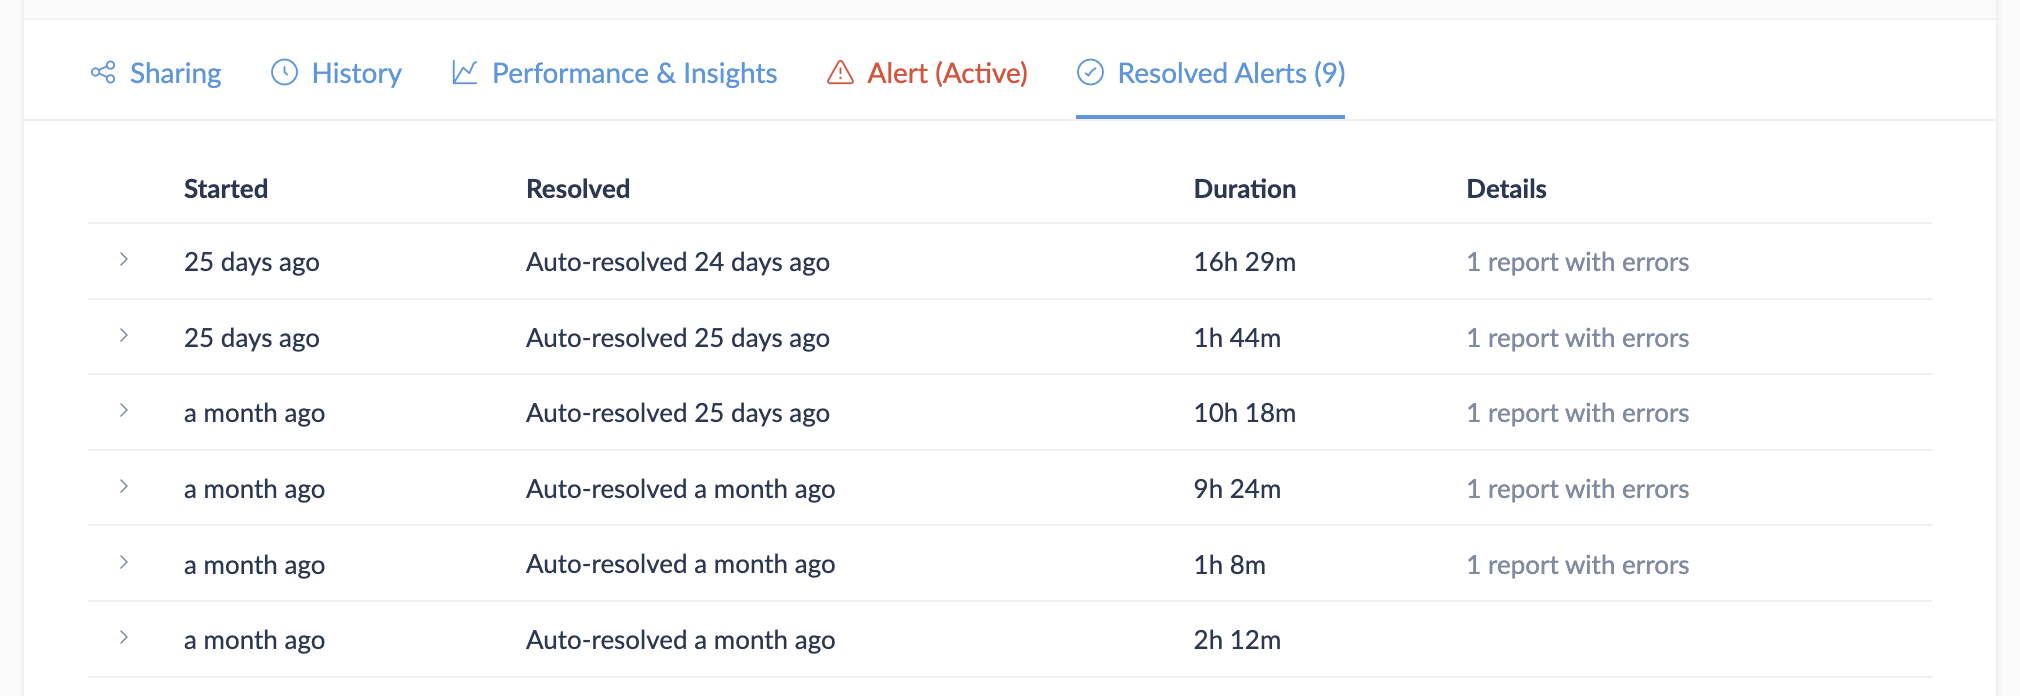
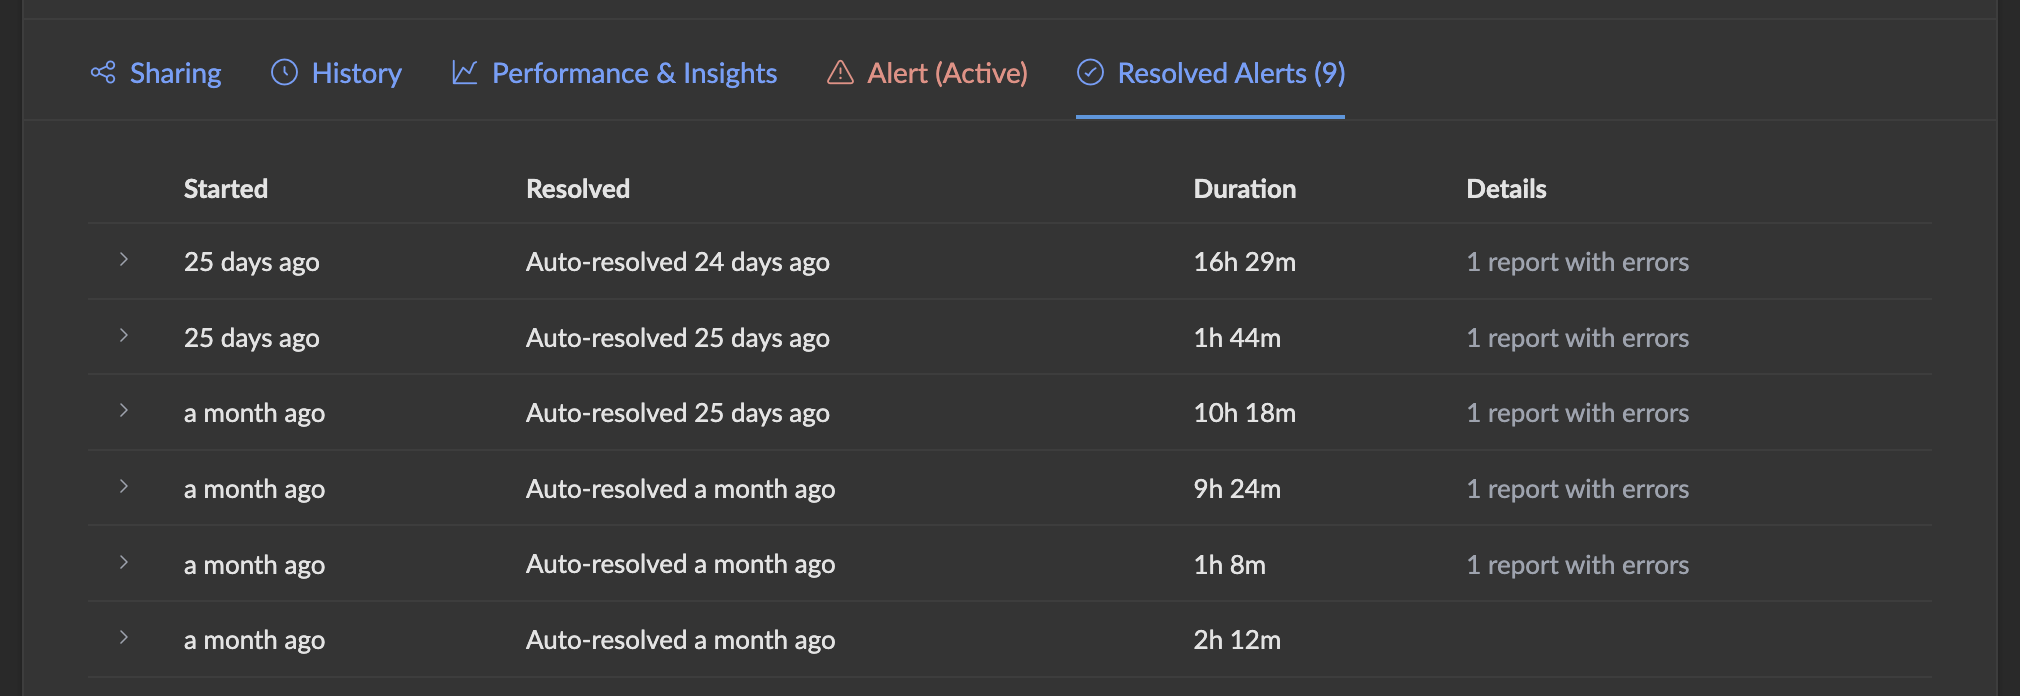
Each alert entry shows:
- Status — Active, Acknowledged, or Resolved
- Started — When the alert was first triggered (relative time with absolute tooltip)
- Acknowledged/Resolved — Who performed the action and when
- Duration — How long the alert was active
- Details — Number of query errors and slow queries during the alert period
Click on the status, started time, or duration to navigate to Performance & Insights with that alert's time range. Use the dropdown menu on each alert to Investigate, Acknowledge, Unacknowledge, or Resolve.
The Alerts tab label shows the total count and current state, for example:
Alerts (4)— 4 resolved alerts, no active alertAlerts (1 active | 3 resolved)— Active alert with 3 past resolved alertsAlerts (1 acknowledged | 3 resolved)— Acknowledged alert with 3 past resolved alerts
Dashboards List
The Settings > Dashboards page provides an overview of all dashboards with their monitoring status.
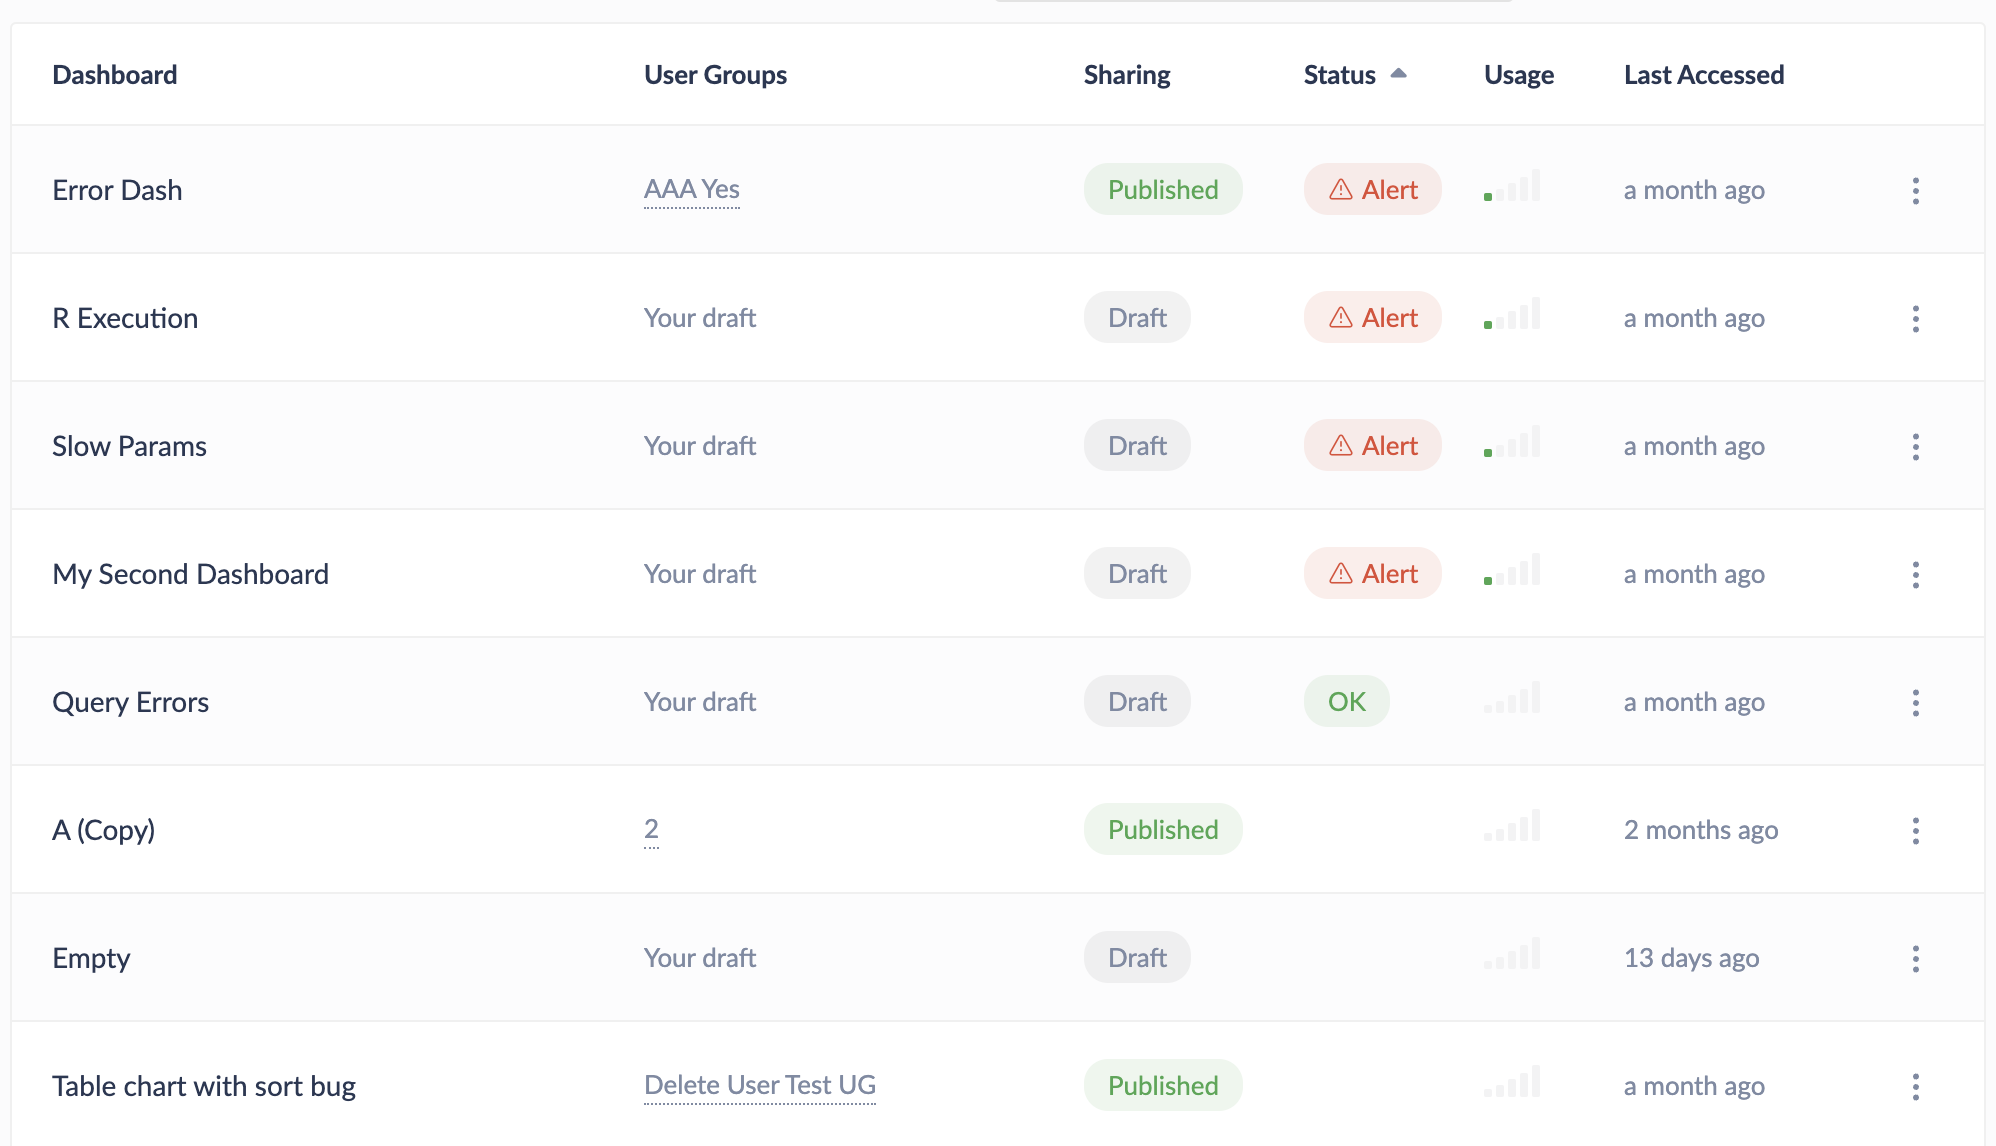
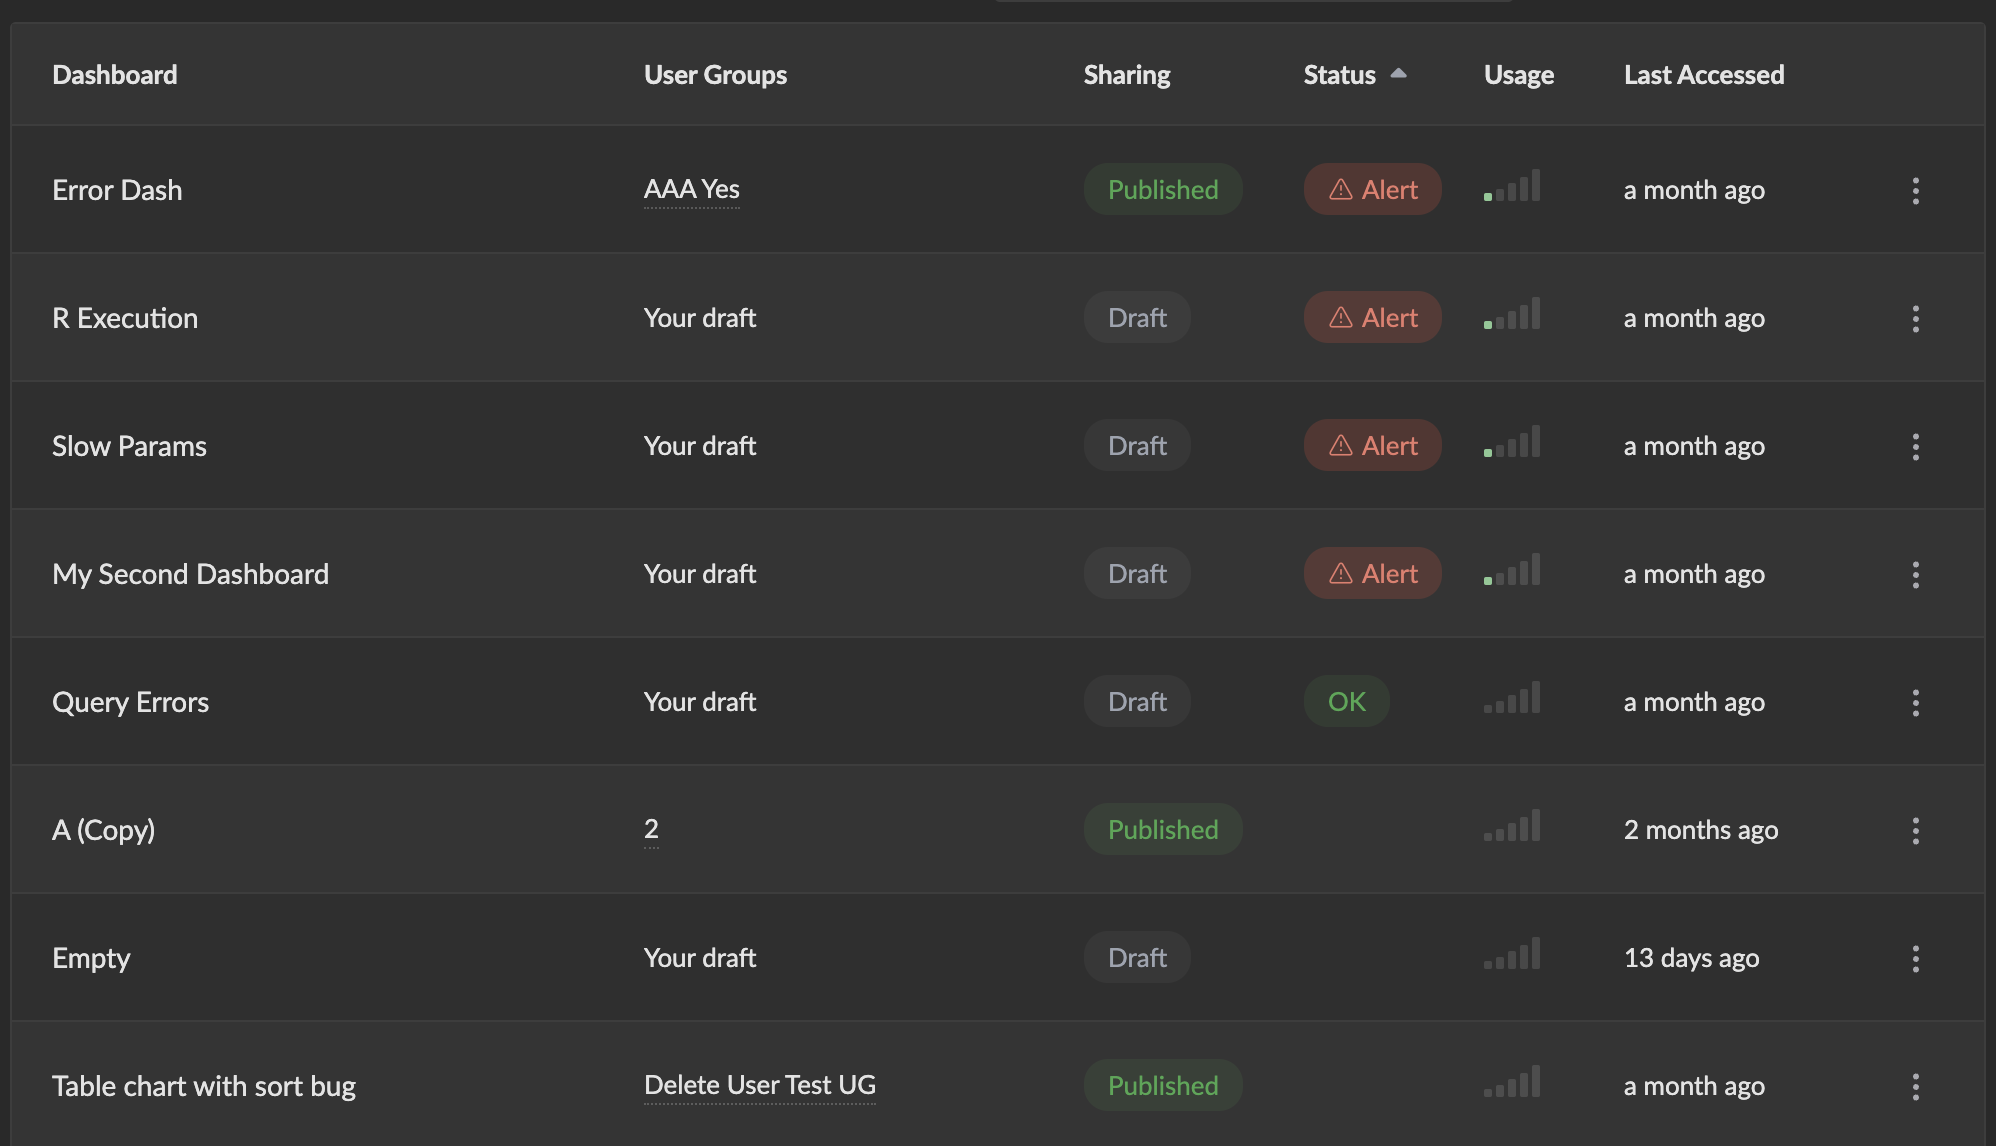
The Status column shows:
- Alert (red) — Active unacknowledged alert
- Alert (yellow) — Acknowledged alert
- OK (green) — Monitoring enabled, no issues
Click on a status badge to navigate directly to that dashboard's Performance & Insights view. Sort by the Status column to quickly find dashboards with active alerts.
Alert Periods on Charts
When viewing the Activity charts, alert periods are shown as semi-transparent red overlays on the Completed and SQL Duration charts. This helps you correlate query performance with alert incidents.
Use the Select alert time range link in the alert banner to zoom the charts to the current alert's time range.