Dashboard Settings
Dashboard settings control a dashboard's name, appearance, thumbnail, data-refresh behavior, filters and time zone, monitoring, and notes. These settings apply to all reports on the dashboard unless explicitly overridden in the individual report settings.
Open settings from the dashboard dropdown menu or from the dashboard management page in Settings.
Basics
The Basics tab contains the dashboard's name, description, and color scheme. The color scheme determines the default palette for reports whose charts are not configured to use specific colors.
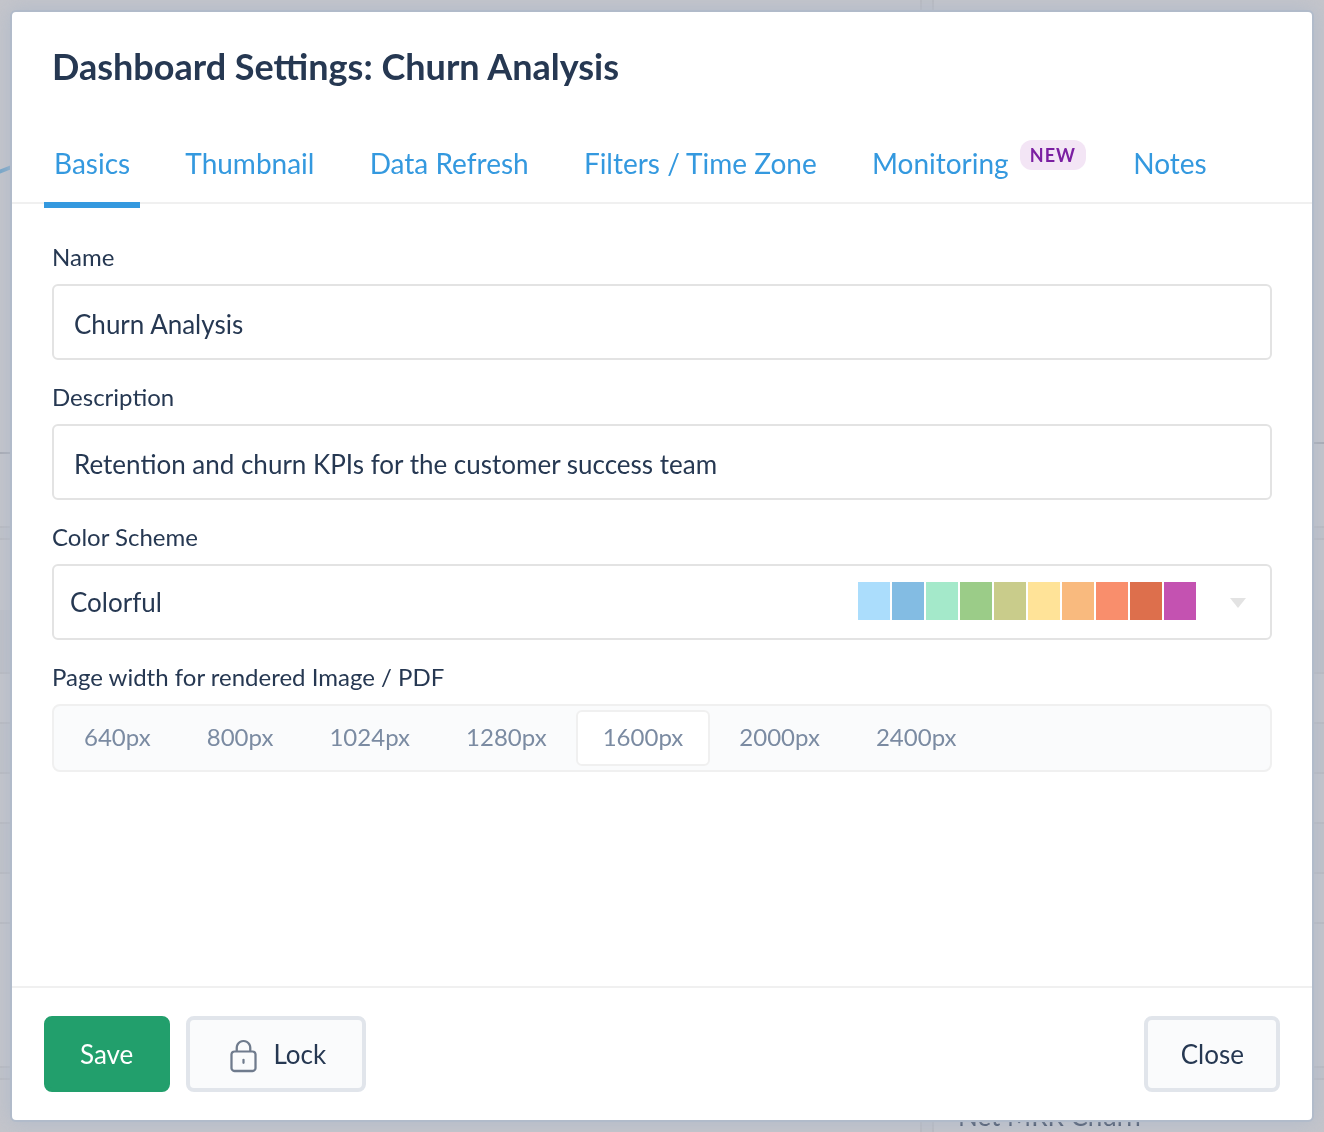
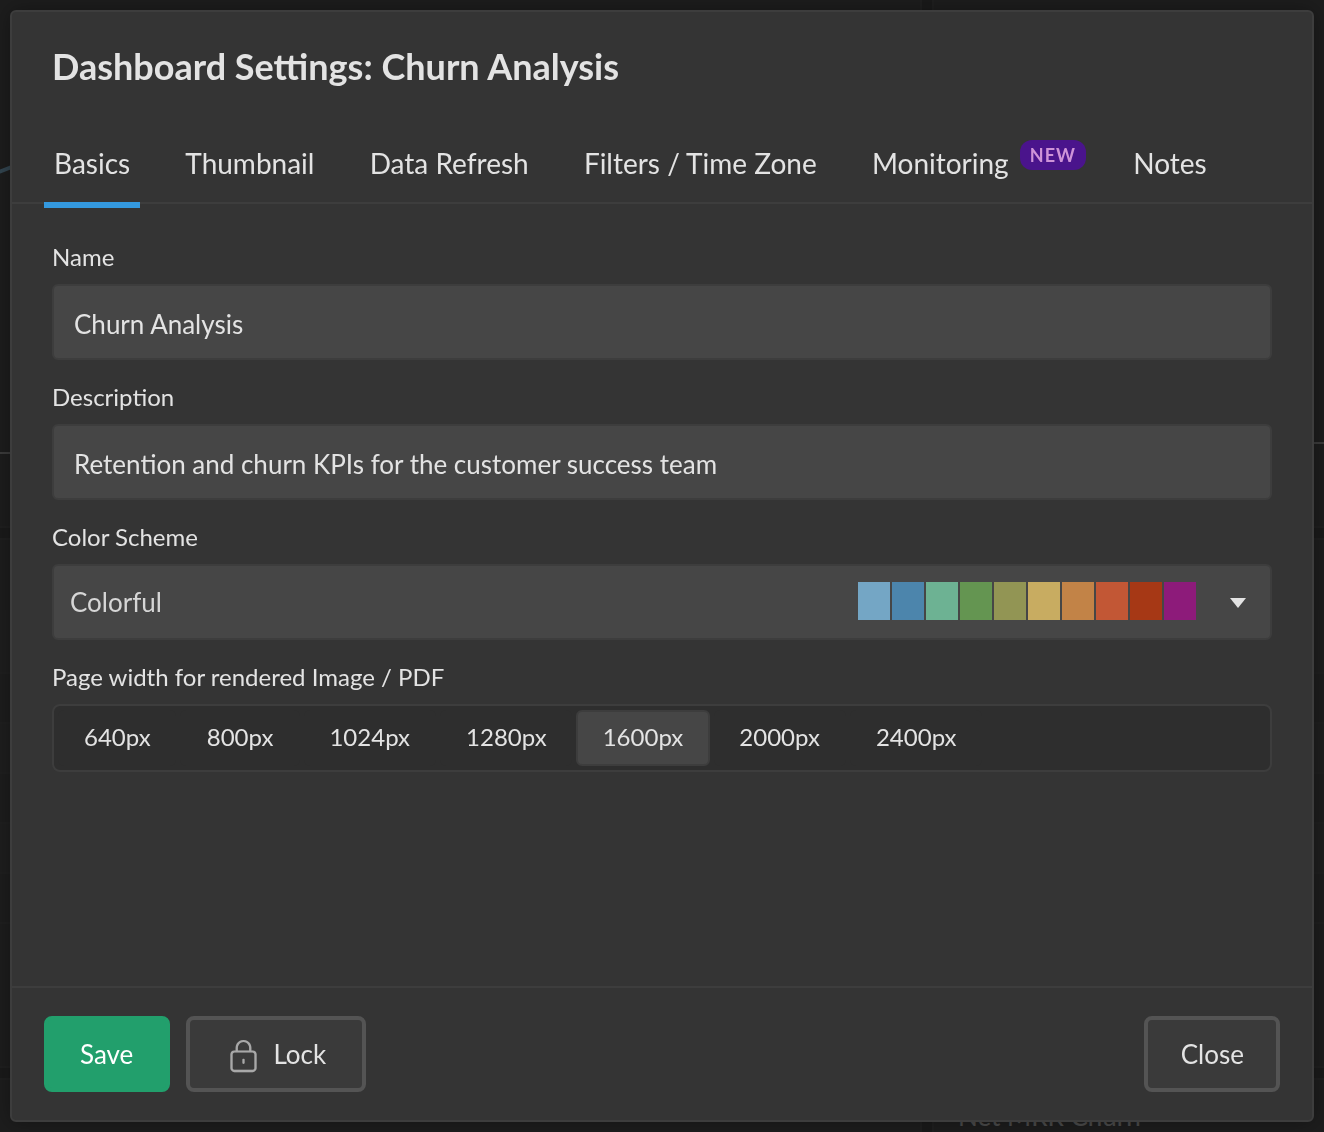
Page width for rendered Image / PDF sets the width — from 640px to 2400px — used when the dashboard is exported via Download Image or Download PDF. A wider page fits more content per row before it wraps.
Thumbnail
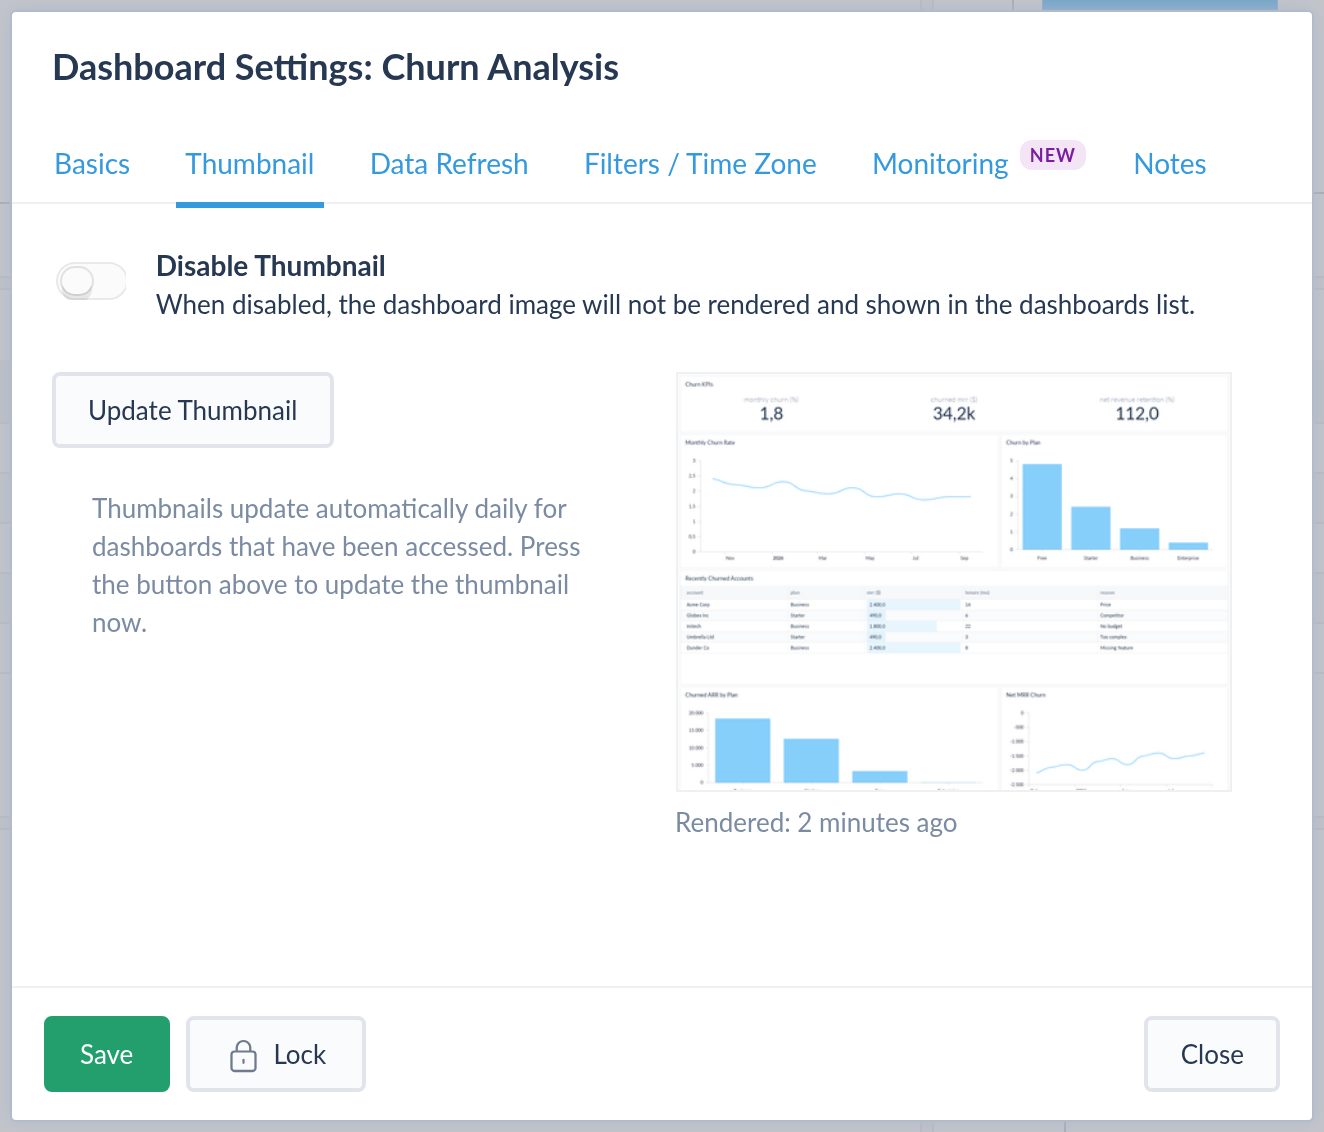
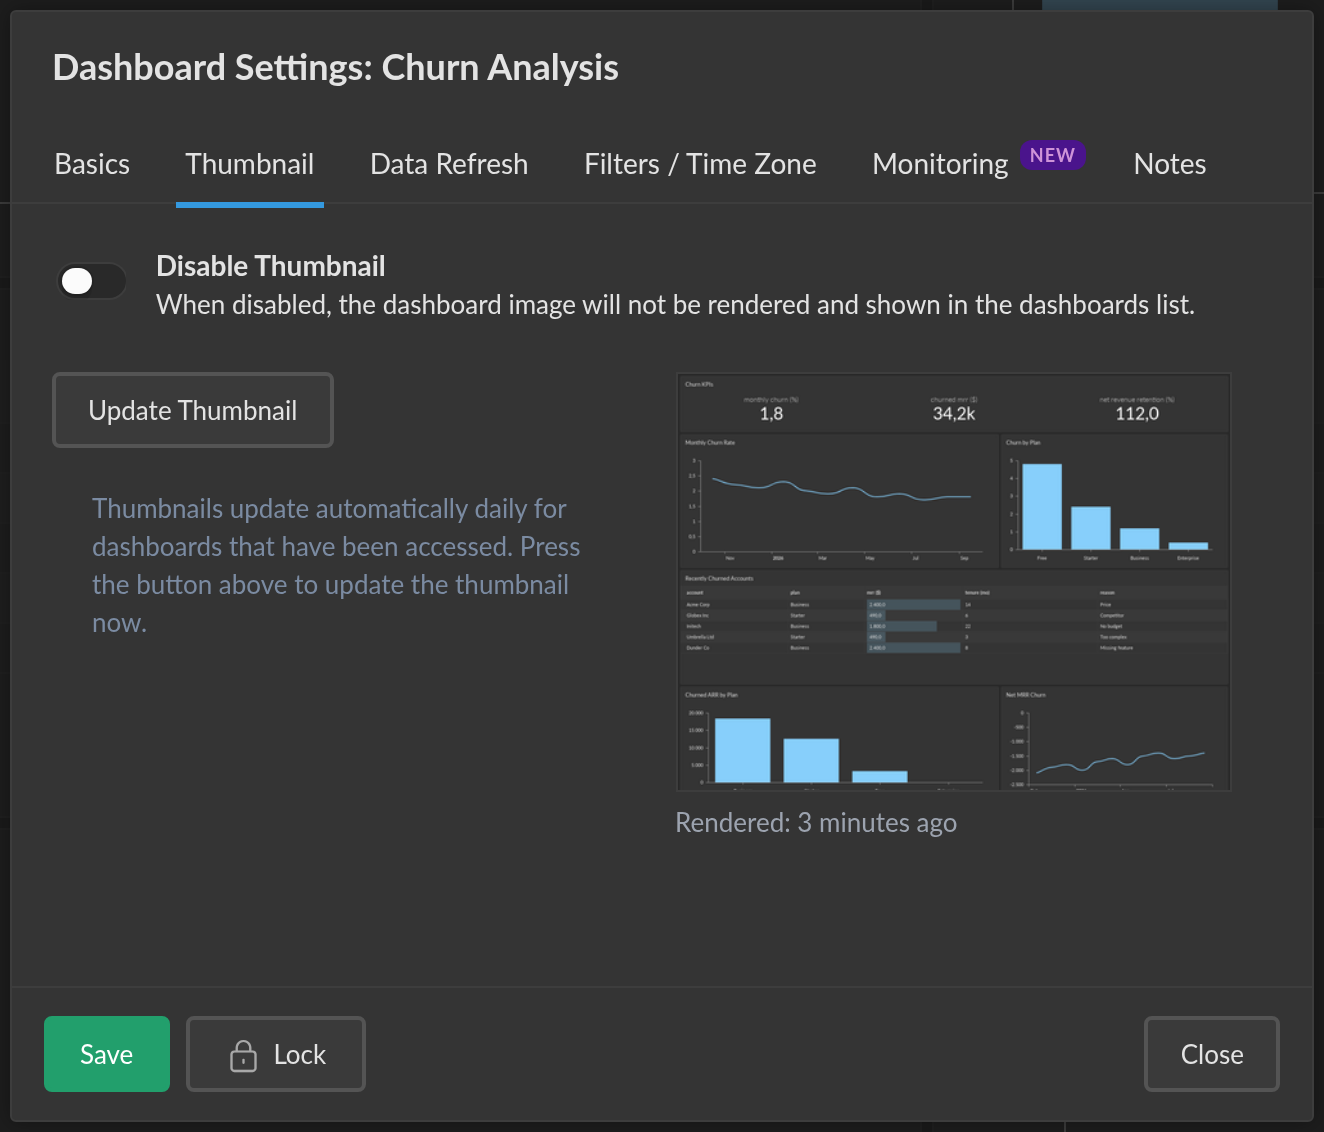
Dashboard thumbnails are generated automatically once a day for dashboards that have been accessed. The Thumbnail tab lets you regenerate the thumbnail manually or disable it entirely — disabled dashboards show a placeholder image instead.
Data Refresh
The Data Refresh tab controls how and when cached data is refreshed for the reports on the dashboard.
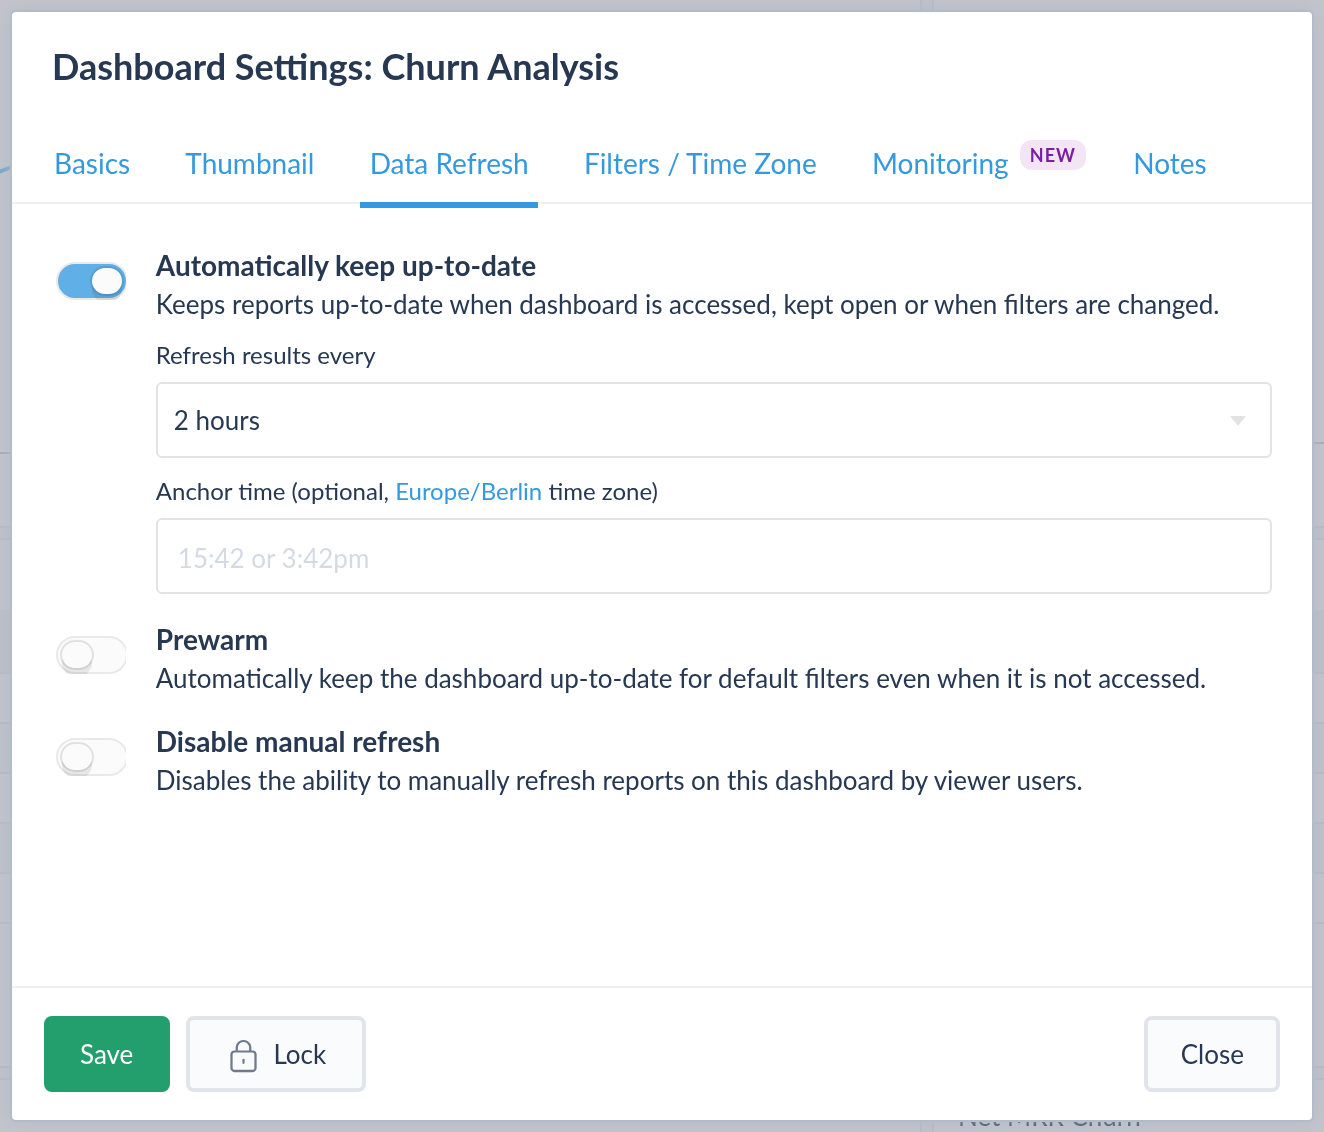
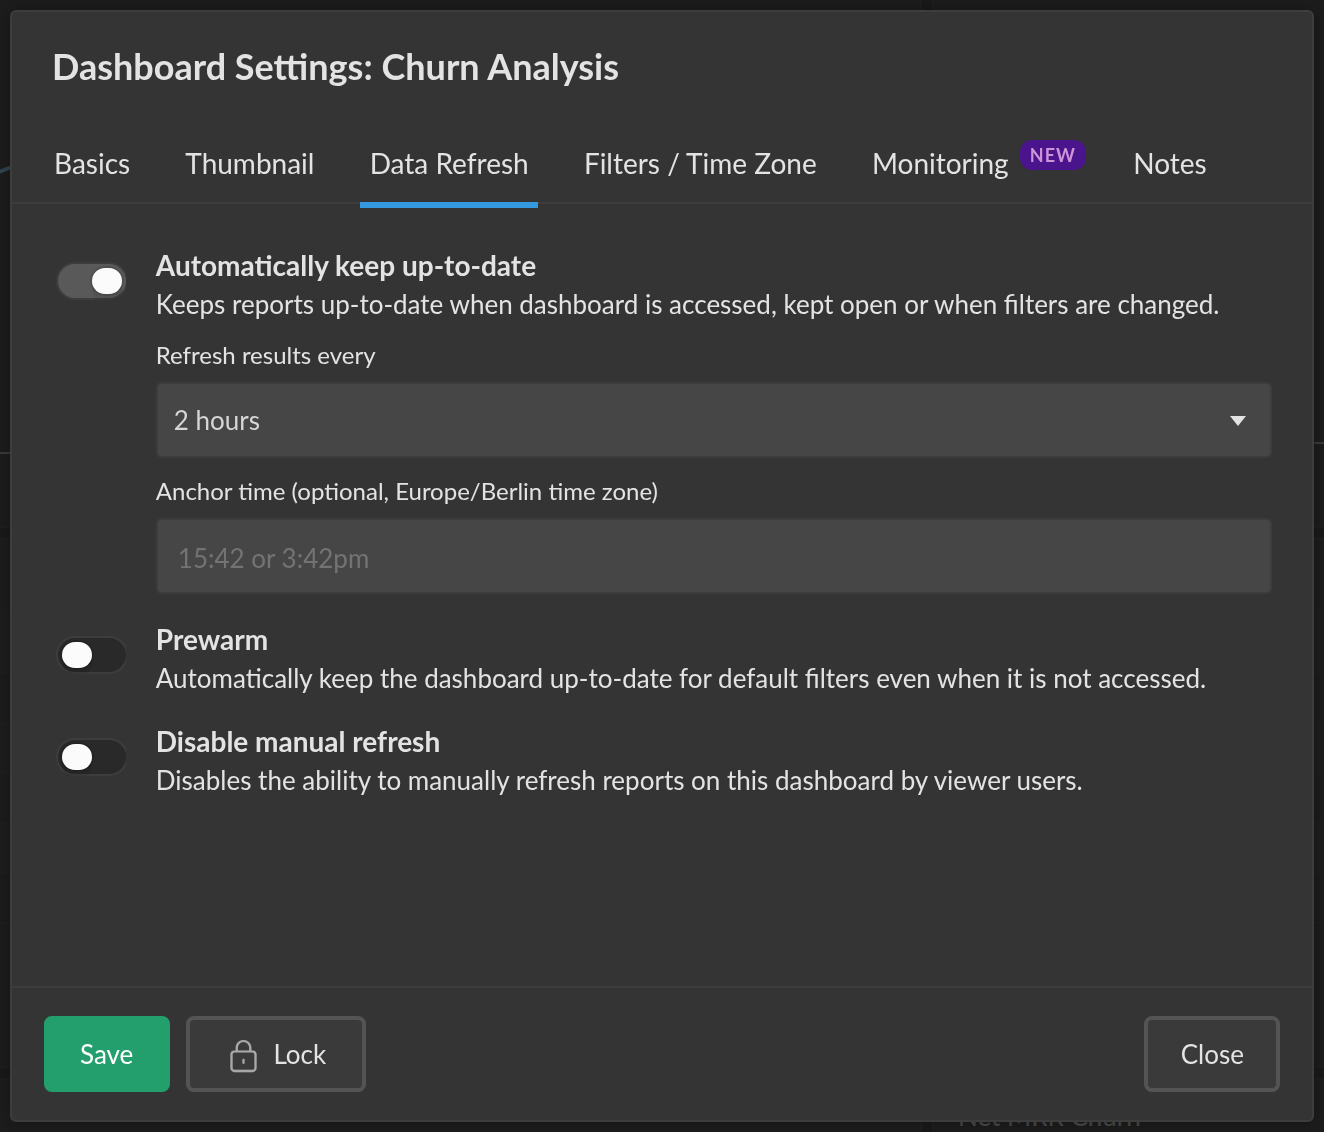
Automatically keep up-to-date is the master switch for automatic refresh. When on, reports are kept up-to-date when the dashboard is accessed, kept open, or when filters are changed, according to the refresh rate below. When off, data is only refreshed manually.
Refresh Rate
Refresh results every sets the maximum age of cached data. When a user views the dashboard and the cached data is older than this rate, the SQL queries are re-executed automatically. The default is 24 hours. The minimum available rate depends on your subscription plan (see Plans Comparison).
Individual reports can override this rate in their own report settings.
Anchor Time
The anchor time ensures that cached data is never older than a specific time of day (in the organization time zone). This is useful when a 24-hour refresh rate is sufficient in general, but data should never be stale from the previous day — for example, setting the anchor time to midnight guarantees the first viewer each morning gets fresh data.
Prewarm
Prewarm keeps the dashboard up-to-date for its default filter values even when nobody is viewing it, so the first visitor sees fresh data without waiting for queries to run.
Disable Manual Refresh
Disable manual refresh removes the ability for viewer users to manually re-run the dashboard's reports, which is useful for controlling load on your database.
Filters / Time Zone
The Filters / Time Zone tab controls the dashboard's time zone, how its filter bar behaves, and the order and visibility of its filters. The filter bar always shows the union of all filters used by any report on the dashboard.
Dashboard Time Zone
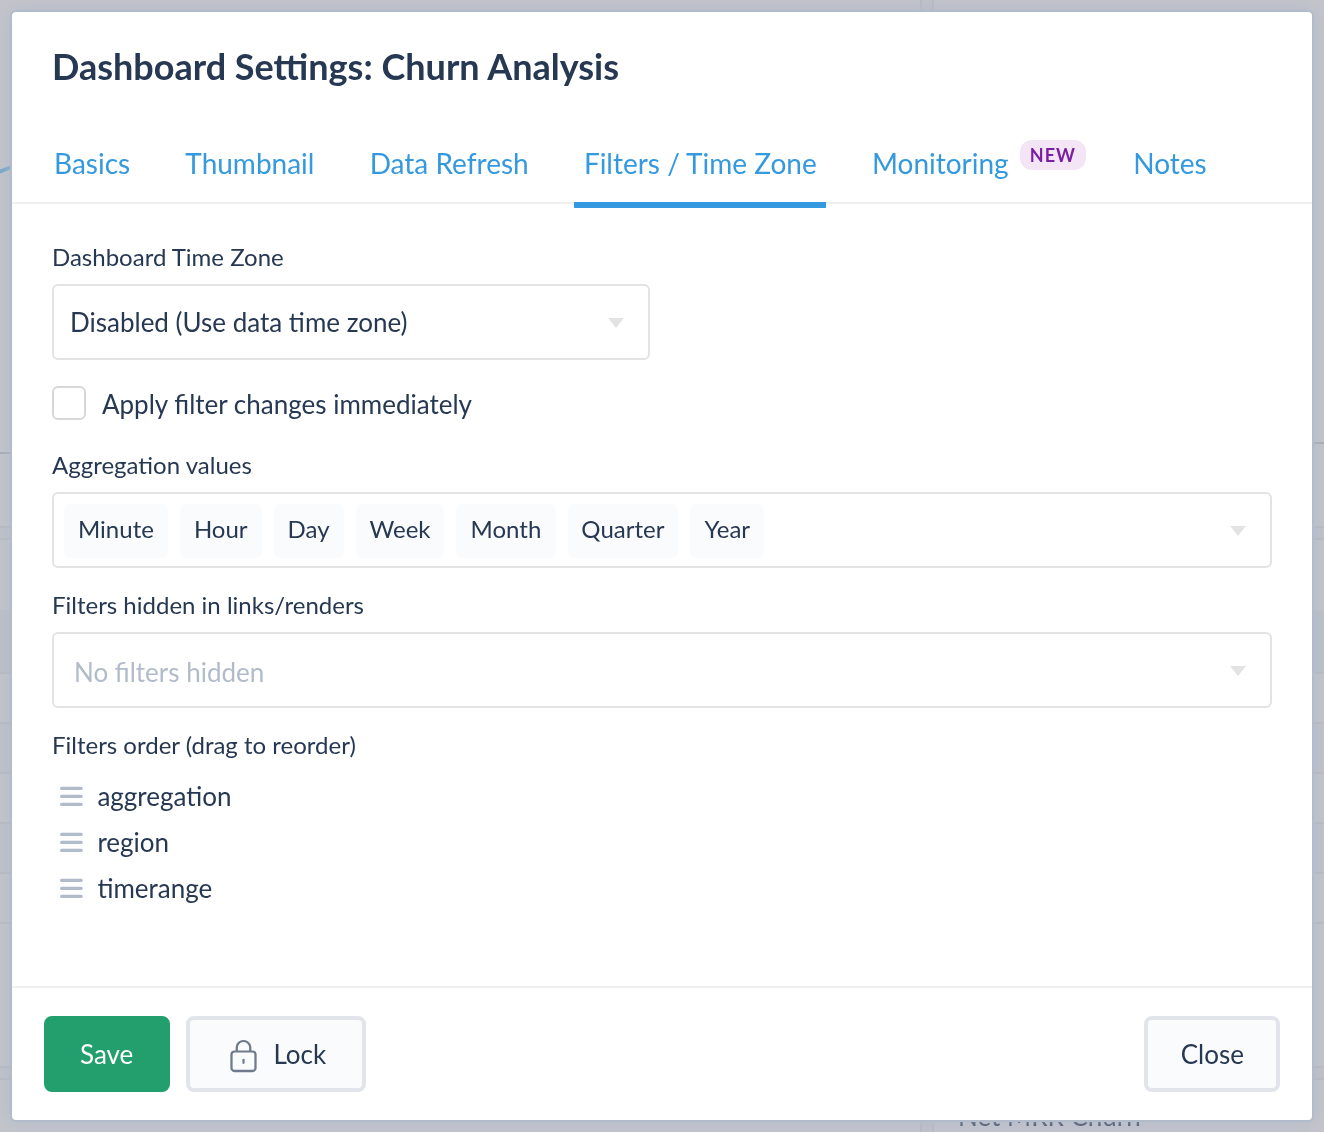
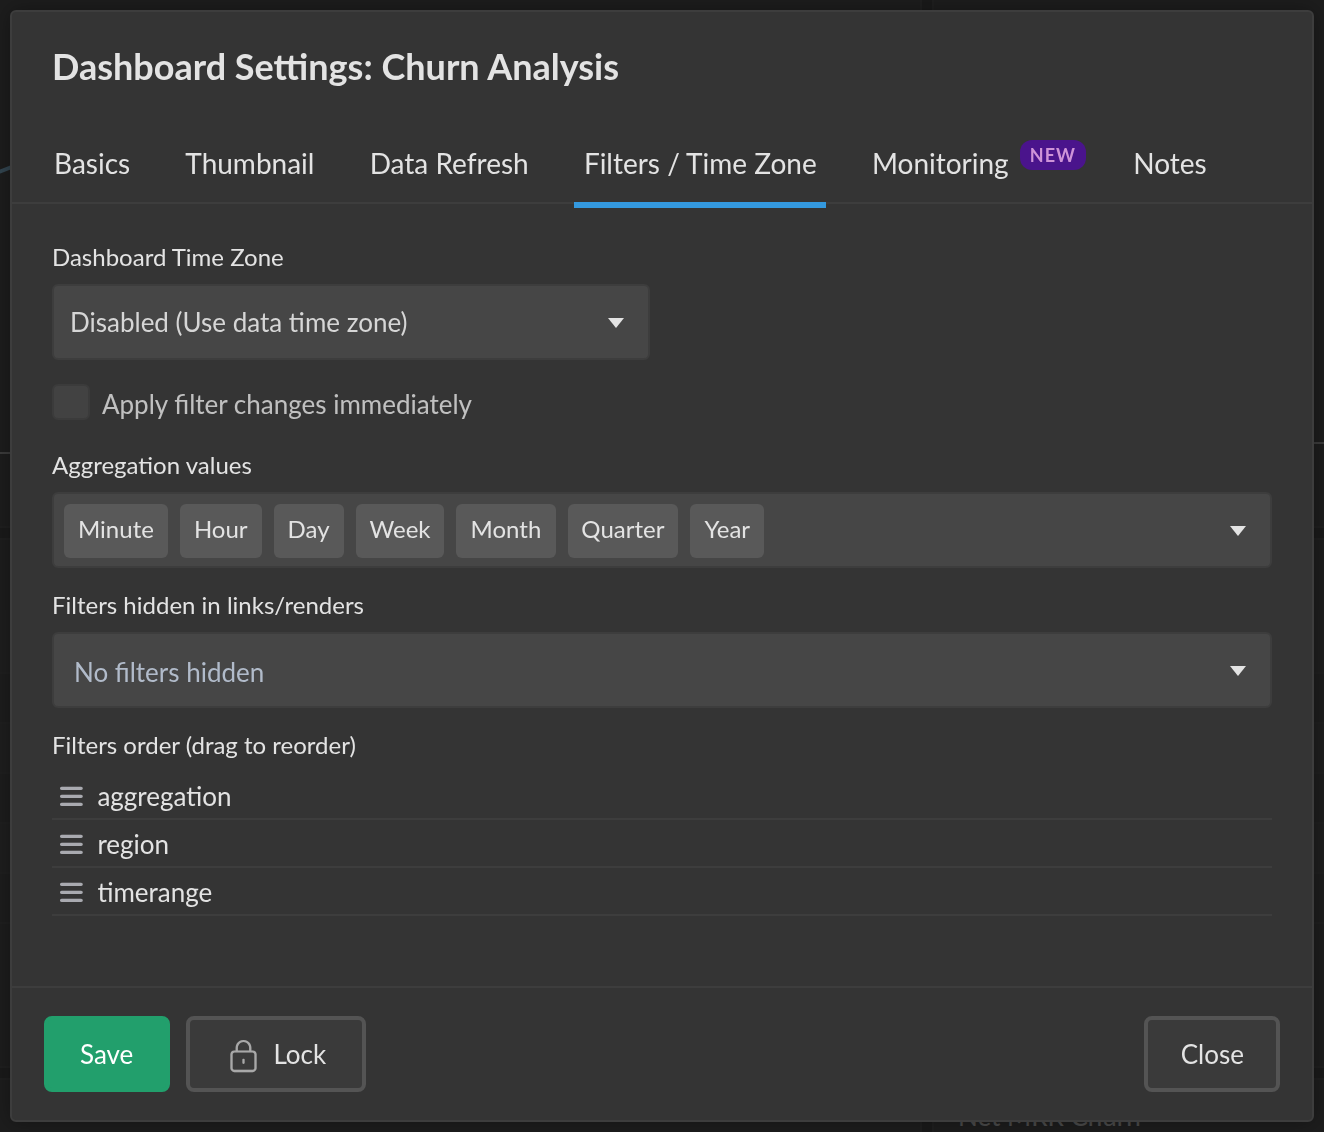
Sets the dashboard time zone applied to time-based data and filters on this dashboard. When set to Disabled (Use data time zone), the data's own time zone is used.
Apply Filter Changes Immediately
When on, changing a filter value re-runs the affected reports right away. When off, viewers can adjust several filters and then click Apply to run them together — useful for dashboards with slow queries.
Aggregation Values
Choose which options appear in the dashboard's built-in aggregation filter — any subset of Minute, Hour, Day, Week, Month, Quarter, and Year.
Filter Order and Visibility
- Filters order — drag filters into the order they should appear in the filter bar.
- Filters hidden in links/renders — hide specific filters from sharing links, embeds, and rendered exports (PDF / image) while keeping their default values applied.
To rename a filter's label, edit its filter definition.
Monitoring
The Monitoring tab enables per-dashboard query monitoring and email alerts. When enabled, query performance is tracked for the dashboard's reports, and admins and analysts can be notified when SQL errors or slow queries are detected.
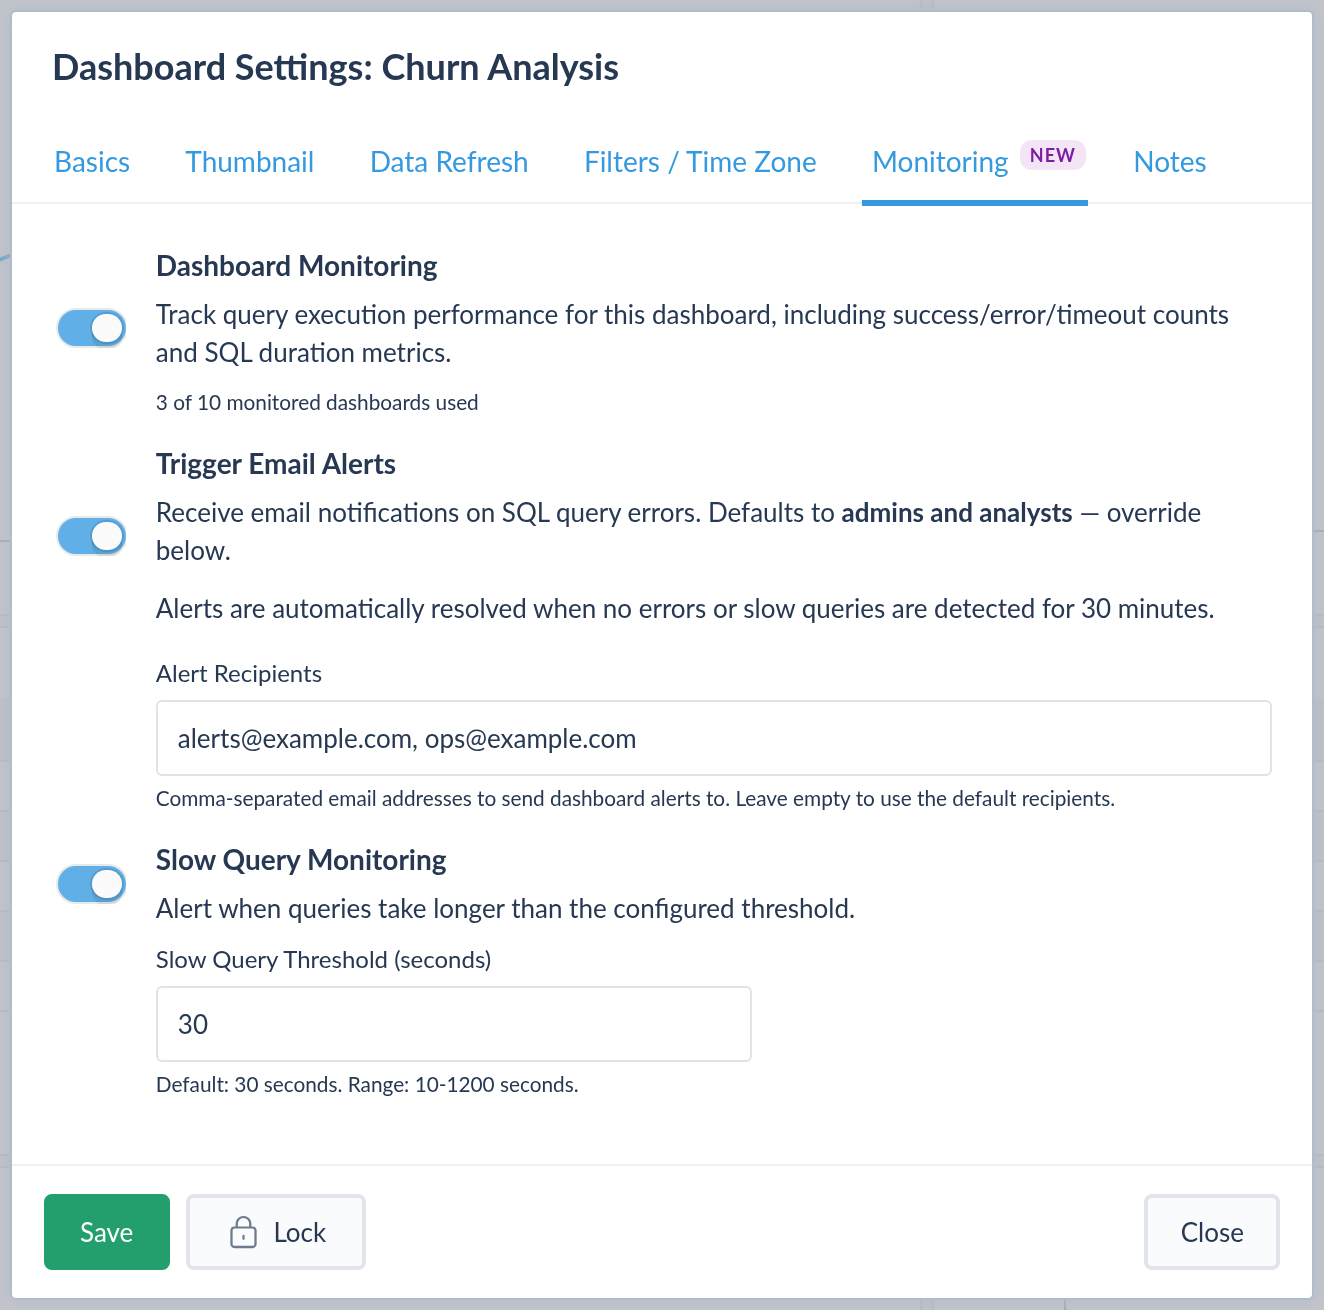
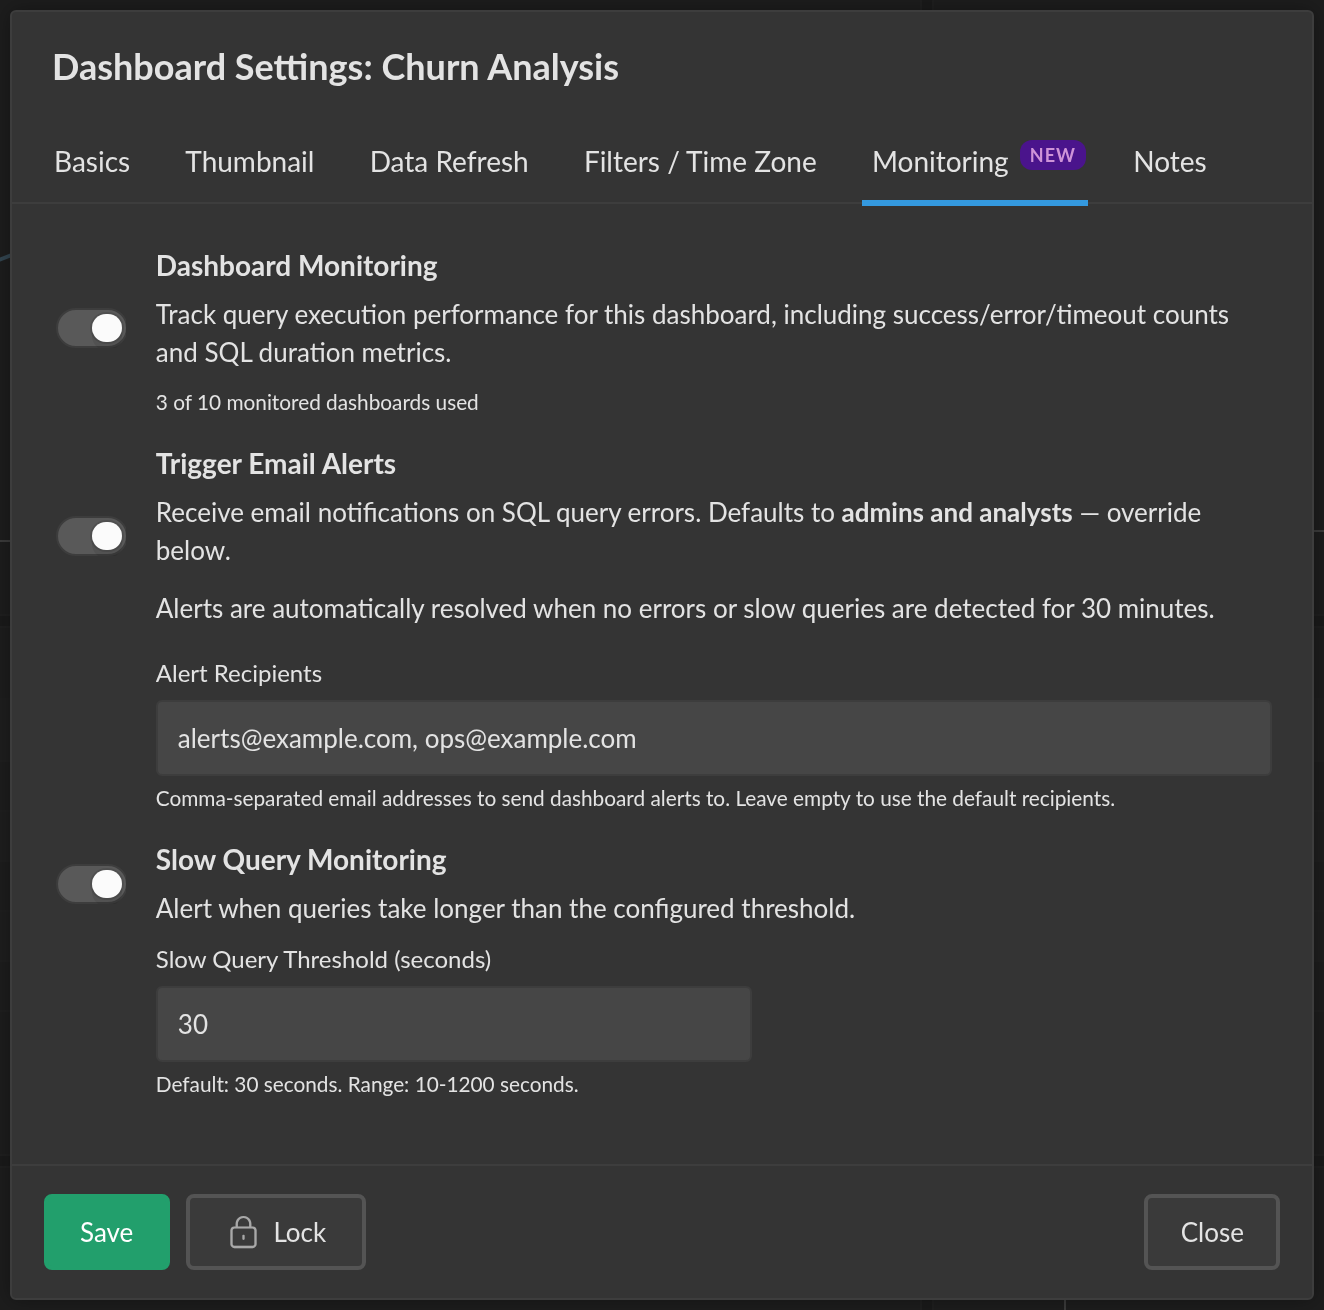
See Monitored Dashboards for full details on setting up and using dashboard monitoring.
Locking
Lock, in the settings footer, freezes the dashboard. Saving the dashboard, its reports or its layout is then refused with Dashboard is locked, please unlock it to save changes, and Edit Layout is disabled with a tooltip saying the same. Reading and refreshing are unaffected — this protects the dashboard everyone relies on from being rearranged by accident, it does not hide it from anyone.
The button reads Unlock while the dashboard is locked, and both actions are recorded in its change history.
A locked dashboard carries a green Locked badge on its card in Settings → Dashboards & Sharing Links, and a lock icon in the list's Sharing / Lock column — which groups the locked dashboards first when you sort by it, in either direction. Duplicating a locked dashboard produces an unlocked copy.
Notes
The Notes tab provides a free-form text area for keeping internal notes about the dashboard — for example, documenting its data sources, known caveats, or to-dos for your team.