Connectivity Alerts
Available on the Business plan (see Plans Comparison)
Connectivity alerts let you know by email when one of your databases becomes unreachable, and again when the connection comes back.
They are separate from Performance & Insights, which reports on queries that ran and failed. A connectivity alert is about the database being unreachable in the first place.
What triggers an alert
When a datasource connection fails in the context of a query execution, a dedicated datasource connectivity check runs. An alert opens only if that test also fails. Any query can trigger a datasource connectivity check, not only the reports and filters on your dashboards.
For a BigQuery datasource a failed query results in a connectivity check only for errors unrelated to the query itself: an invalid or revoked service key, a project that does not exist or that the key may not use, billing not enabled on the project, or BigQuery itself failing. A query that fails because of its SQL, a table that does not exist, or a table the key may not read opens no alert.
A connection test of the saved datasource is evaluated the same way, and opens an alert if it fails. That includes the test that runs when you save the datasource, and Test Connection in its settings when there are no unsaved changes. Testing changes you have not saved yet leaves alerts alone. To see an alert for yourself, save the datasource with a wrong port.
That confirmation step matters: a single failed connection is often a momentary blip, such as a connection pool being briefly full. Those test clean and produce no alert, and you see the failed query as an ordinary query error instead.
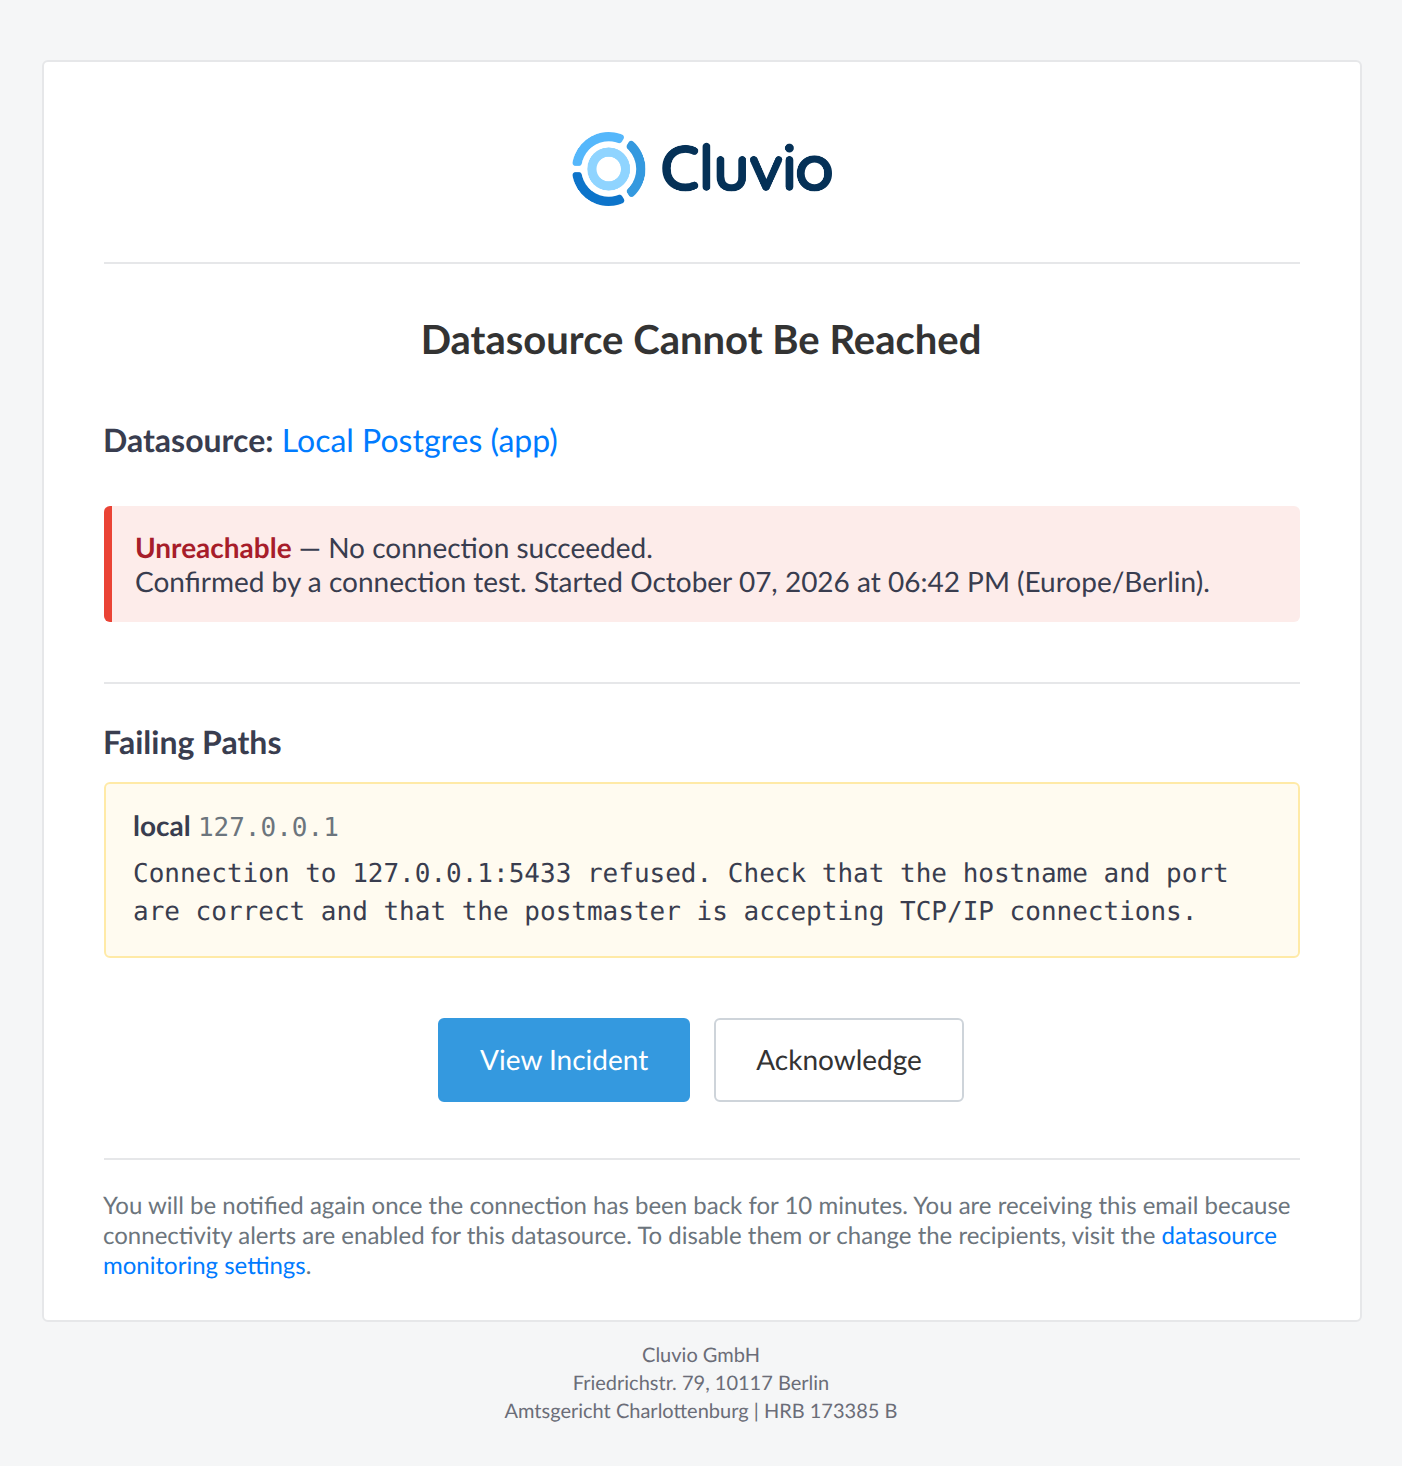
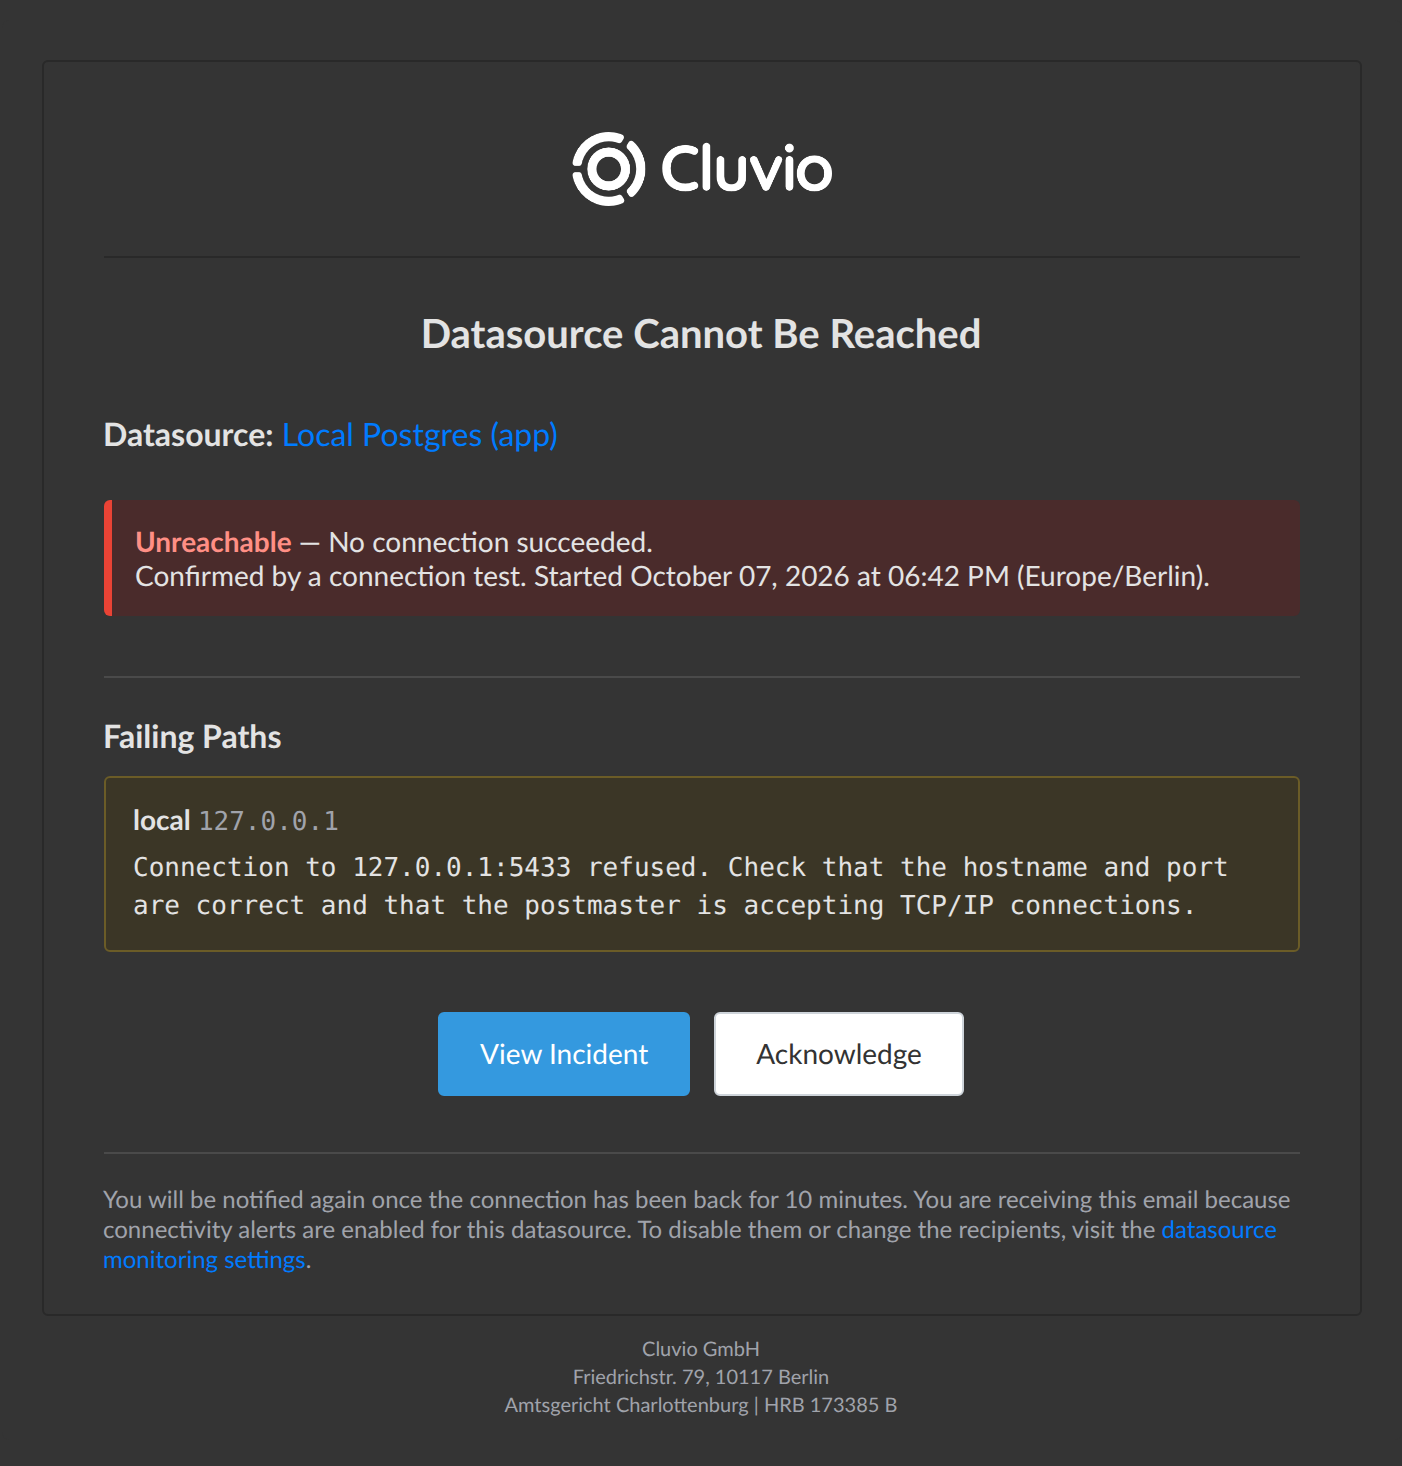
The alert email names each path that failed and what it reported:
When nobody is using the datasource
Without queries executing, an outage at night or over a weekend is noticed only when someone next opens a dashboard. To be told sooner, set Check When Idle on the datasource. When no query has used the datasource for the time you chose, its connection is tested on every path. A failing test is treated like a failed query: the connection is tested again, and an alert opens only if that test fails too.
A datasource in use is not checked on this schedule, because its own queries already show a failure within seconds. Nor is one with an open alert, which is tested on its own schedule until the connection has held for 10 minutes.
Connectivity alerts cover database datasources. Static tables and script executors have no database connection to test.
Datasource Reachability
A datasource is reached over one or more paths, and every one of them is tested:
- A direct or SSH-tunnelled connection to a database behind a firewall has one path per availability zone, each with its own address.
- An agent connection has one path per agent, named after the agent.
- A cloud database that needs no firewall rules has a single path.
Occasionally a path cannot be tested at all, because of a problem on Cluvio's side rather than your database. It is then left out, so it neither fails the test nor counts as healthy, and the result covers the paths that could be tested. Test Connection in the datasource's settings says which zone it could not test.
The alert tells you what failed:
-
Unreachable: no path could connect. The database is down, or something in front of it is refusing every connection. A datasource with a single path is only ever unreachable.
-
Partial: some paths connect and others do not. The alert names each path that could not get through and what it reported. Across availability zones, each query runs through one of them, so your queries fail intermittently depending on which one runs them. Across agents, a query moves on to an agent that can connect, so queries keep working, but on fewer agents than you set up.
Across availability zones, the usual cause is one address missing from your database's IP allowlist, and the alert names the address. Across agents, it is usually one agent that is stopped, or one that is running and cannot reach the database itself — a firewall between that agent and your database, say, while the others are unaffected.
A partial failure is easy to miss without an alert, because your queries still succeed — most of them across availability zones, and all of them across agents, until the remaining agents fail too.
One alert, not one email per dashboard
When a database goes away, every monitored dashboard using it starts failing at once.
You get a single connectivity alert for the datasource, and it speaks for those dashboards. Their own alerts still open, so their history stays accurate, but they do not email you separately. They are left out of the alert badge in the navigation bar, where the connectivity alert's entry says how many monitored dashboards it affects. The dashboard alerts list marks them Datasource alert, and on the dashboard itself the Alert tab shows the datasource alert's status, with a link to it.
A dashboard alert is covered only while everything failing on that dashboard uses the unreachable datasource. A dashboard that also starts failing on another datasource alerts for itself as usual. Someone who cannot view the datasource sees the dashboard's alert as its own.
When it recovers
The connection keeps being tested while an alert is open, so you learn about recovery even when no queries are running.
Once every path has connected without interruption for 10 minutes, the alert closes and you are emailed that the datasource is reachable again. The wait is deliberate — a connection that comes and goes would otherwise produce a stream of messages, and this way a flapping database still gives you one email at the start and one at the end.
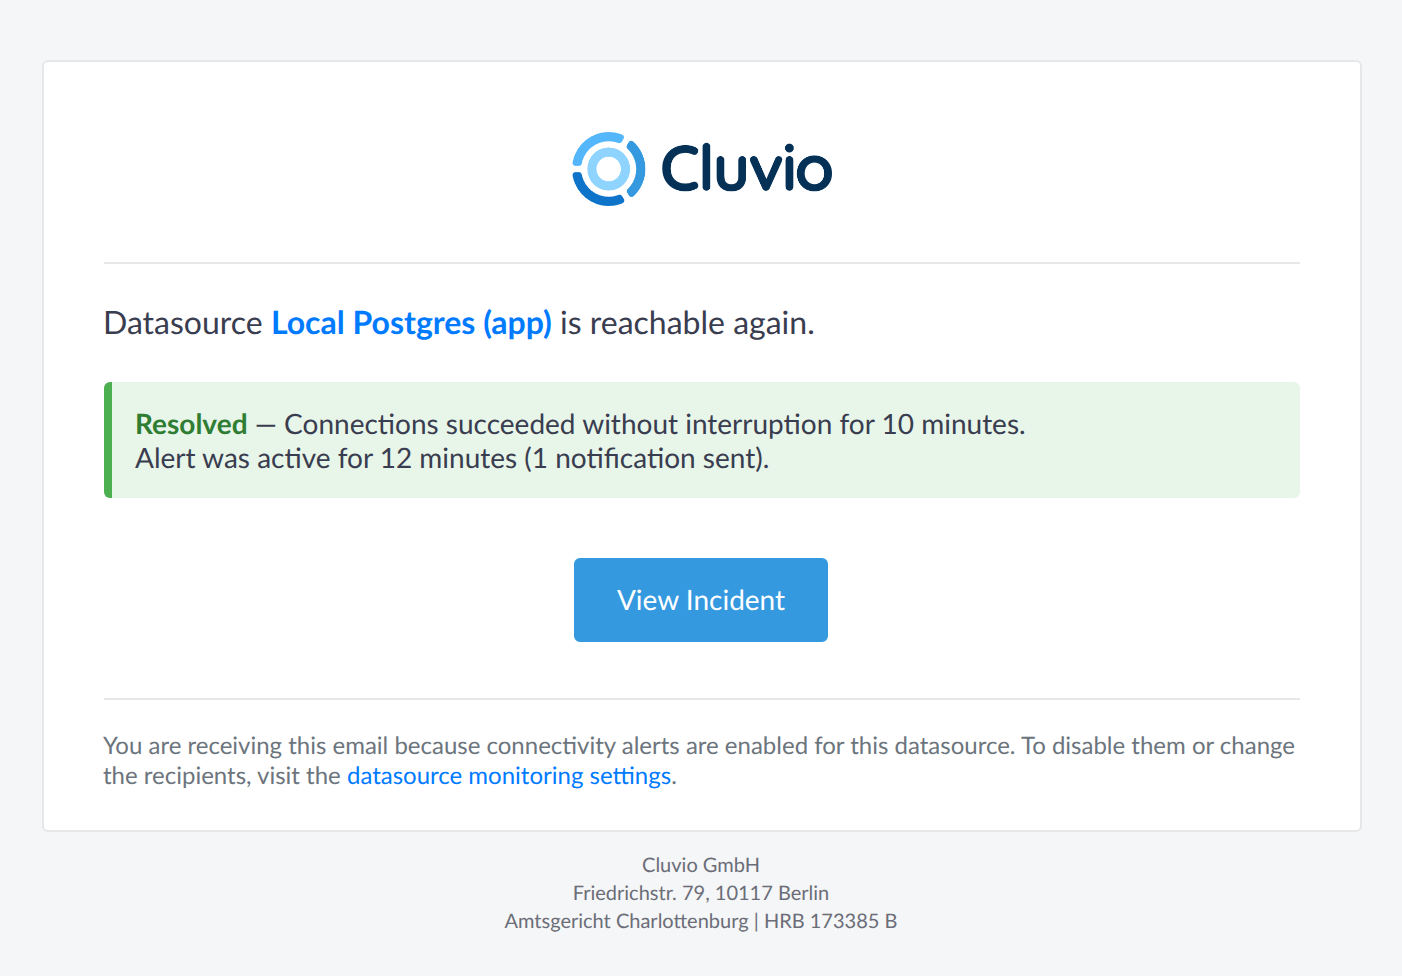
Testing becomes less frequent as an alert ages: every minute for the first quarter hour, then every five minutes, then every fifteen minutes. You learn about a long outage as quickly as a short one; its recovery may take a few minutes longer to confirm.
The dashboard alerts it covered close with it when they were failing only because of the outage, without an email of their own. Any that still fail for another reason go back to alerting for themselves, and the recovery email says how many.
A query that fails five times in a row is normally not run again for up to an hour. When a connectivity alert recovers, that pause is lifted for the queries the outage broke, so your dashboards show current data the next time they load rather than an error.
While an alert is open
An unacknowledged alert shows in the alert badge in the navigation bar, alongside dashboard alerts, and an open one shows as an Alert badge on the datasource in Settings → Datasources.
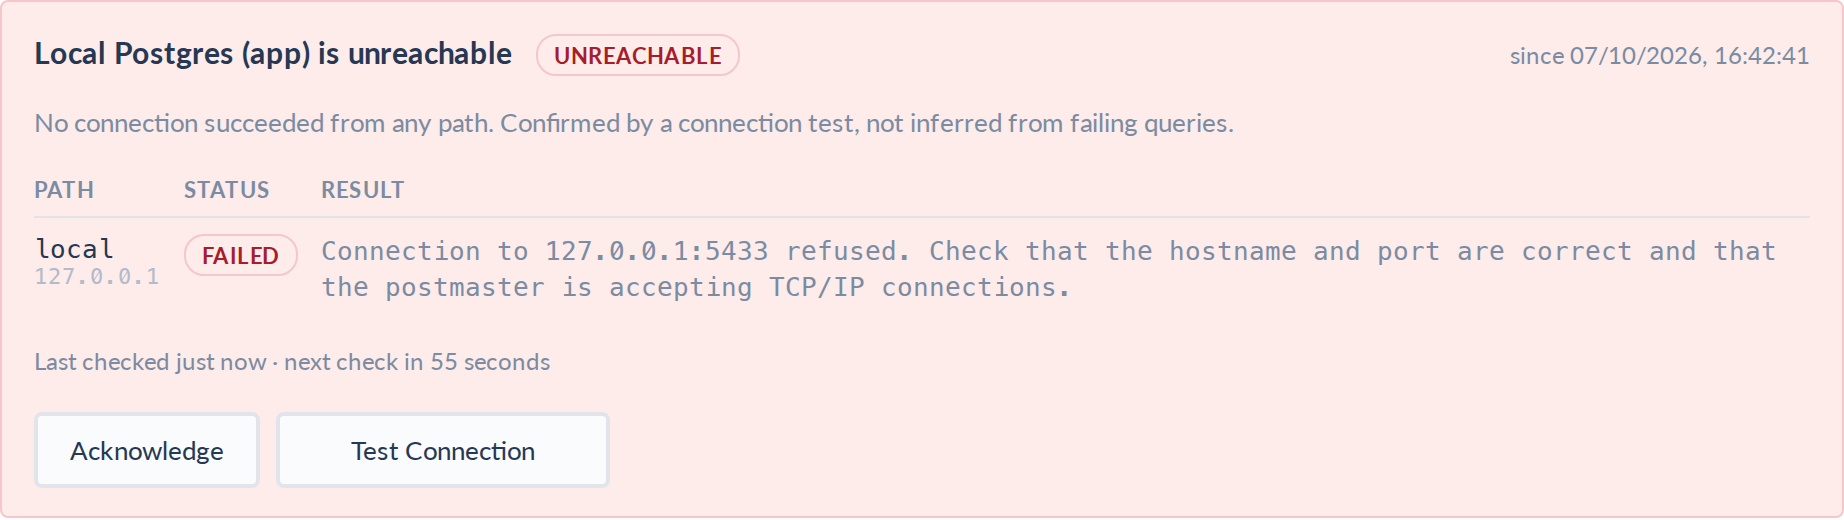
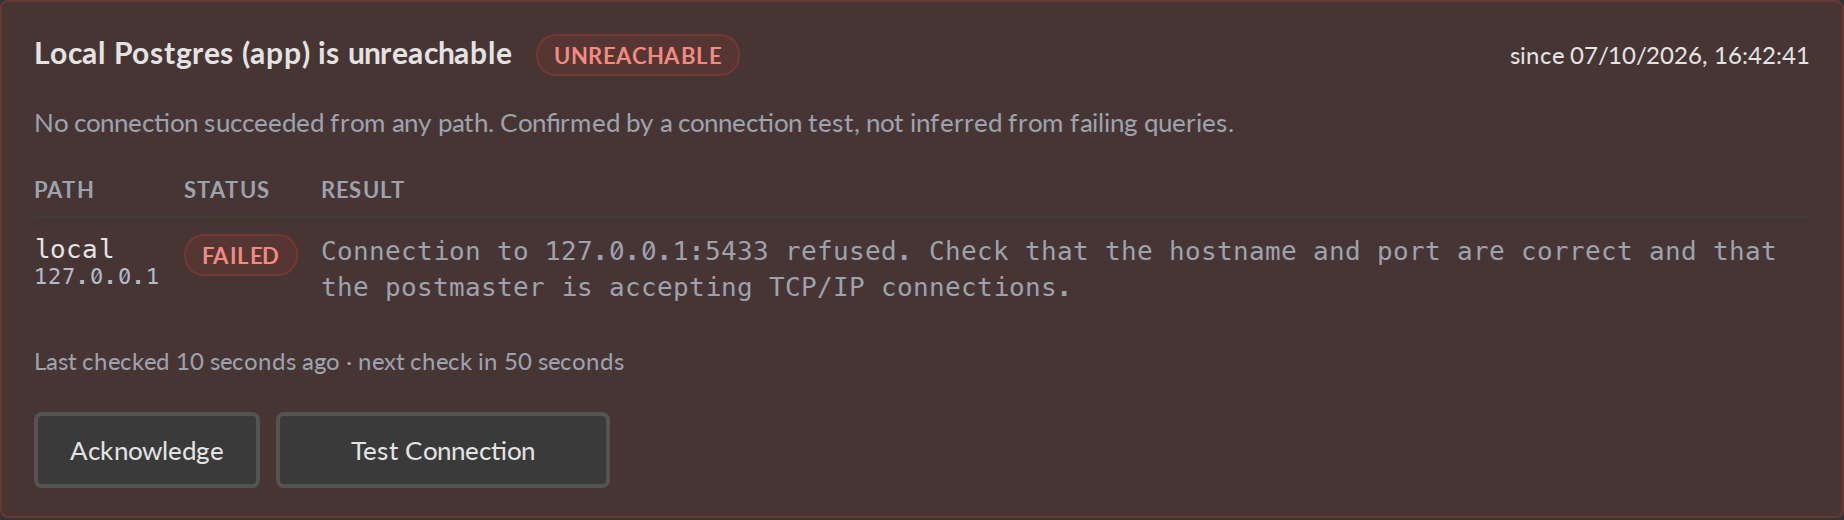
Select the datasource there to open it. Its Alert tab shows the open alert: which paths are failing and what the connection test reported, when the connection was last tested and when it will be tested next, and the monitored dashboards the alert covers. Resolved Alerts lists the closed ones, with how long each lasted and the dashboards it covered. On Performance & Insights, the time an alert was open is shaded red on the activity charts. View Incident in the alert email opens the datasource on the time of the alert.
- Acknowledge: stops the daily reminder, and the alert turns yellow. You are still emailed when the connection returns. The Acknowledge link in the email acknowledges the alert as soon as the page opens; Unacknowledge brings the reminder back.
- Test Connection: tests every path now, rather than at the next scheduled test, and shows the result next to the button. If they all connect, the alert moves to Confirming and counts down to closing: it closes once the connection has held for 10 minutes. Any other test of the saved connection settings counts the same way, including the one that runs when you save the datasource.
- Disabling the datasource: closes the alert within a minute, and stops your database being queried at all. A closed alert is not a recovered one — disabling does not send the "reachable again" email, because nothing was fixed.
Separating connection errors from query errors
During an outage every report on the datasource records an error, which buries the queries that are genuinely broken. The Query Errors tab separates the two, so you can set the outage aside and still find them.
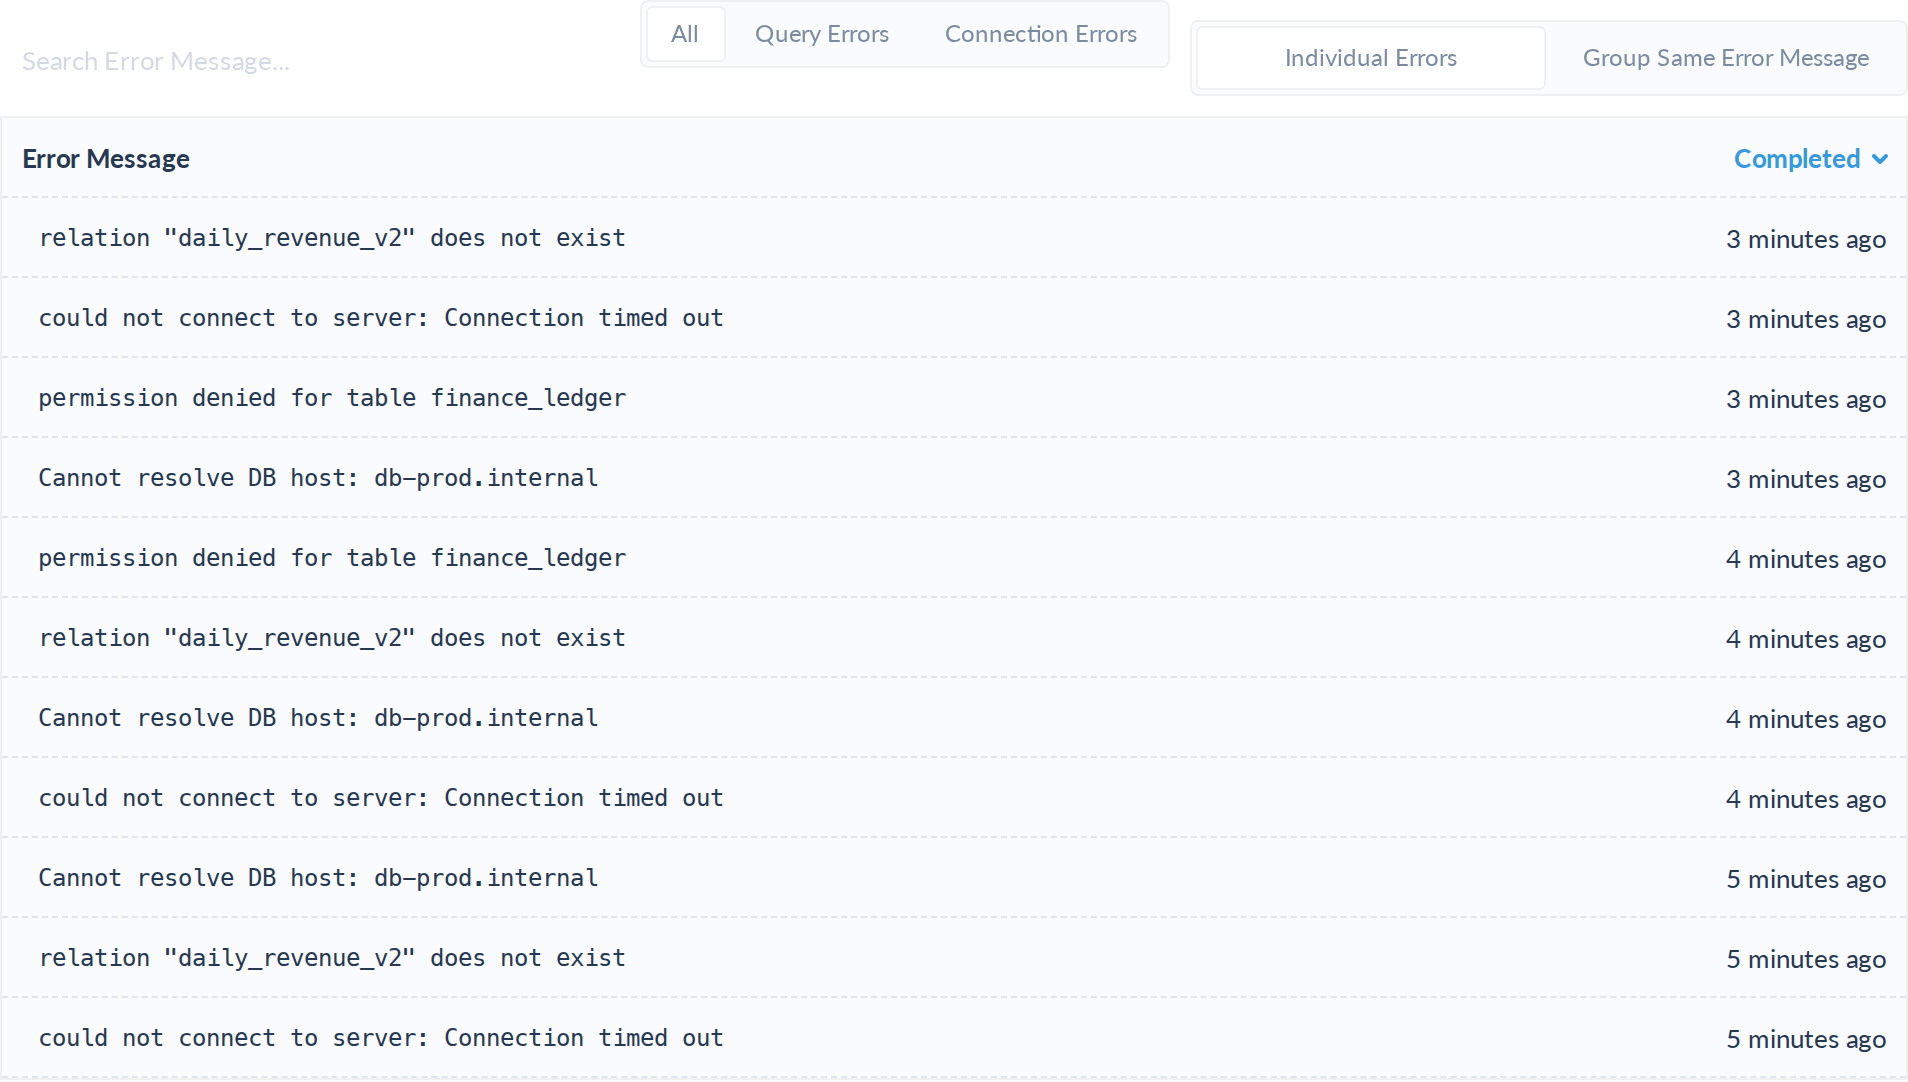
The tab lists errors from reports, filters and SQL alerts. A query you run while writing SQL is not listed there, so an alert it raised can leave the tab empty — the alert rests on the connection test, not on the errors listed.
The Activity tab separates the two as well: on its Completed chart, connection errors are a separate series from query errors.
Settings
Connectivity alerts are off until you turn them on, for each datasource you want alerts for. You turn them on, and choose who receives them, on the Monitoring tab of the datasource's settings.
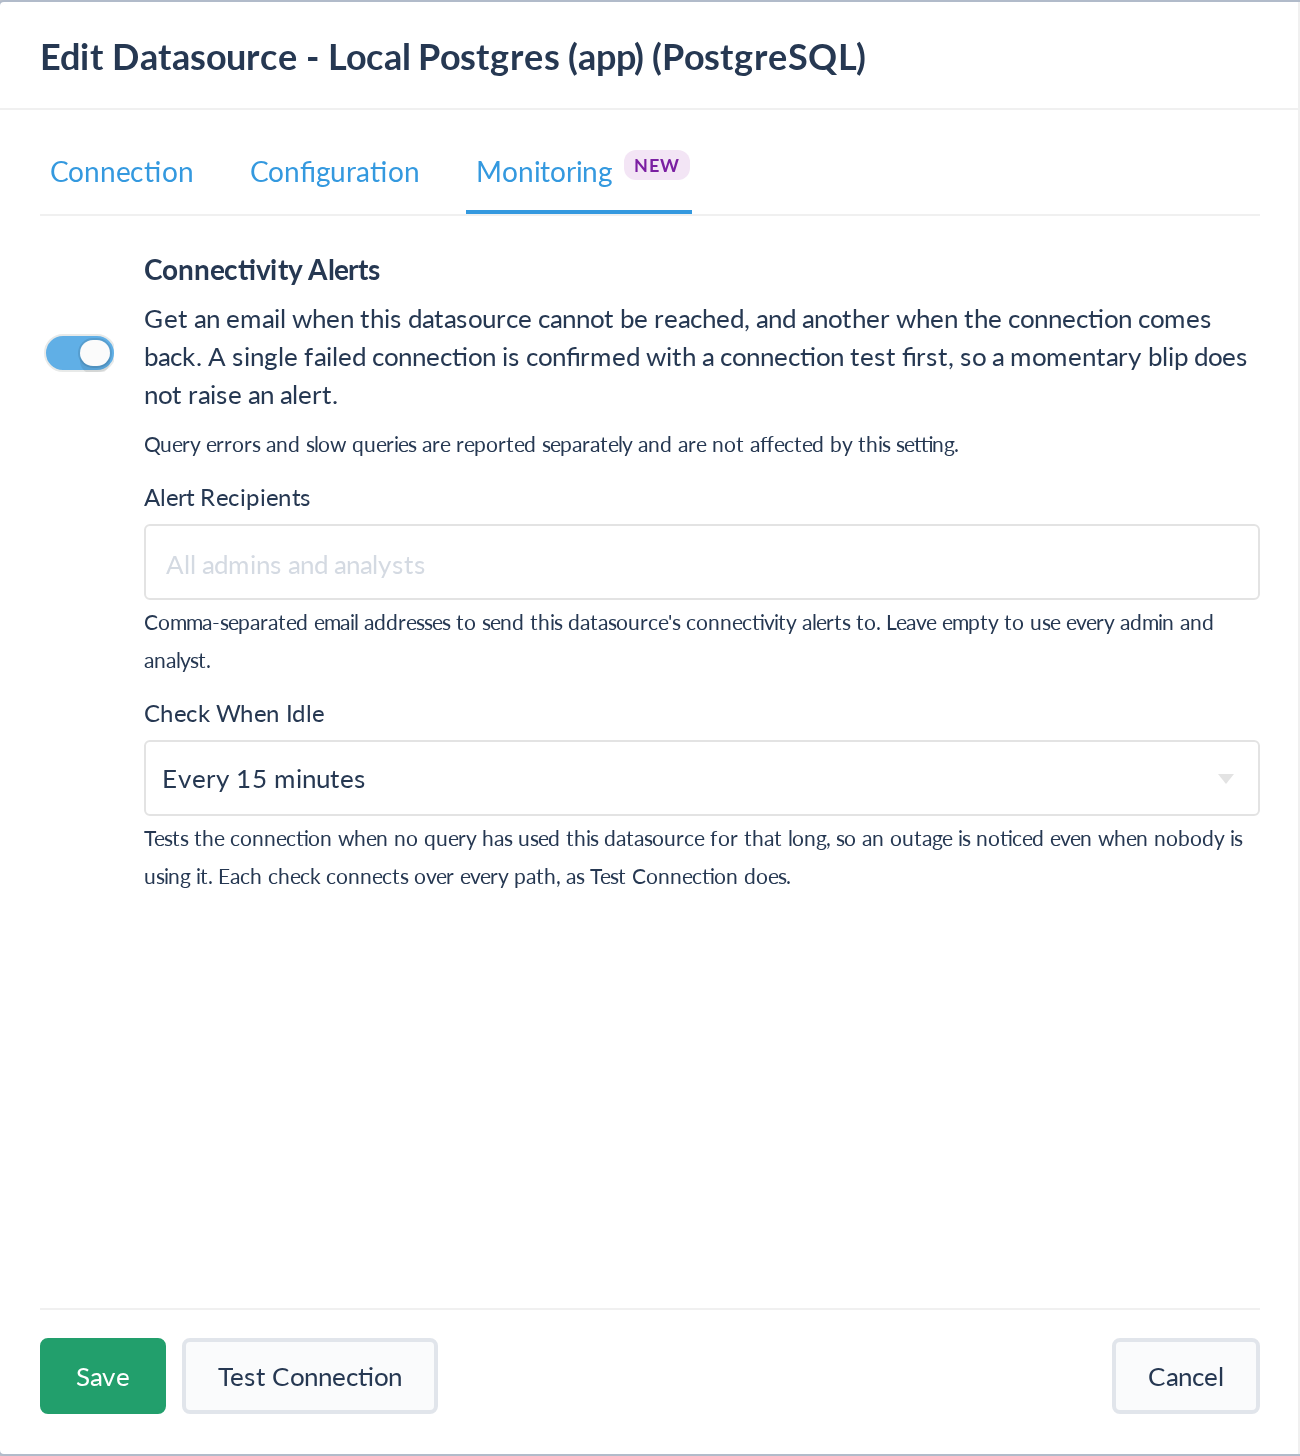
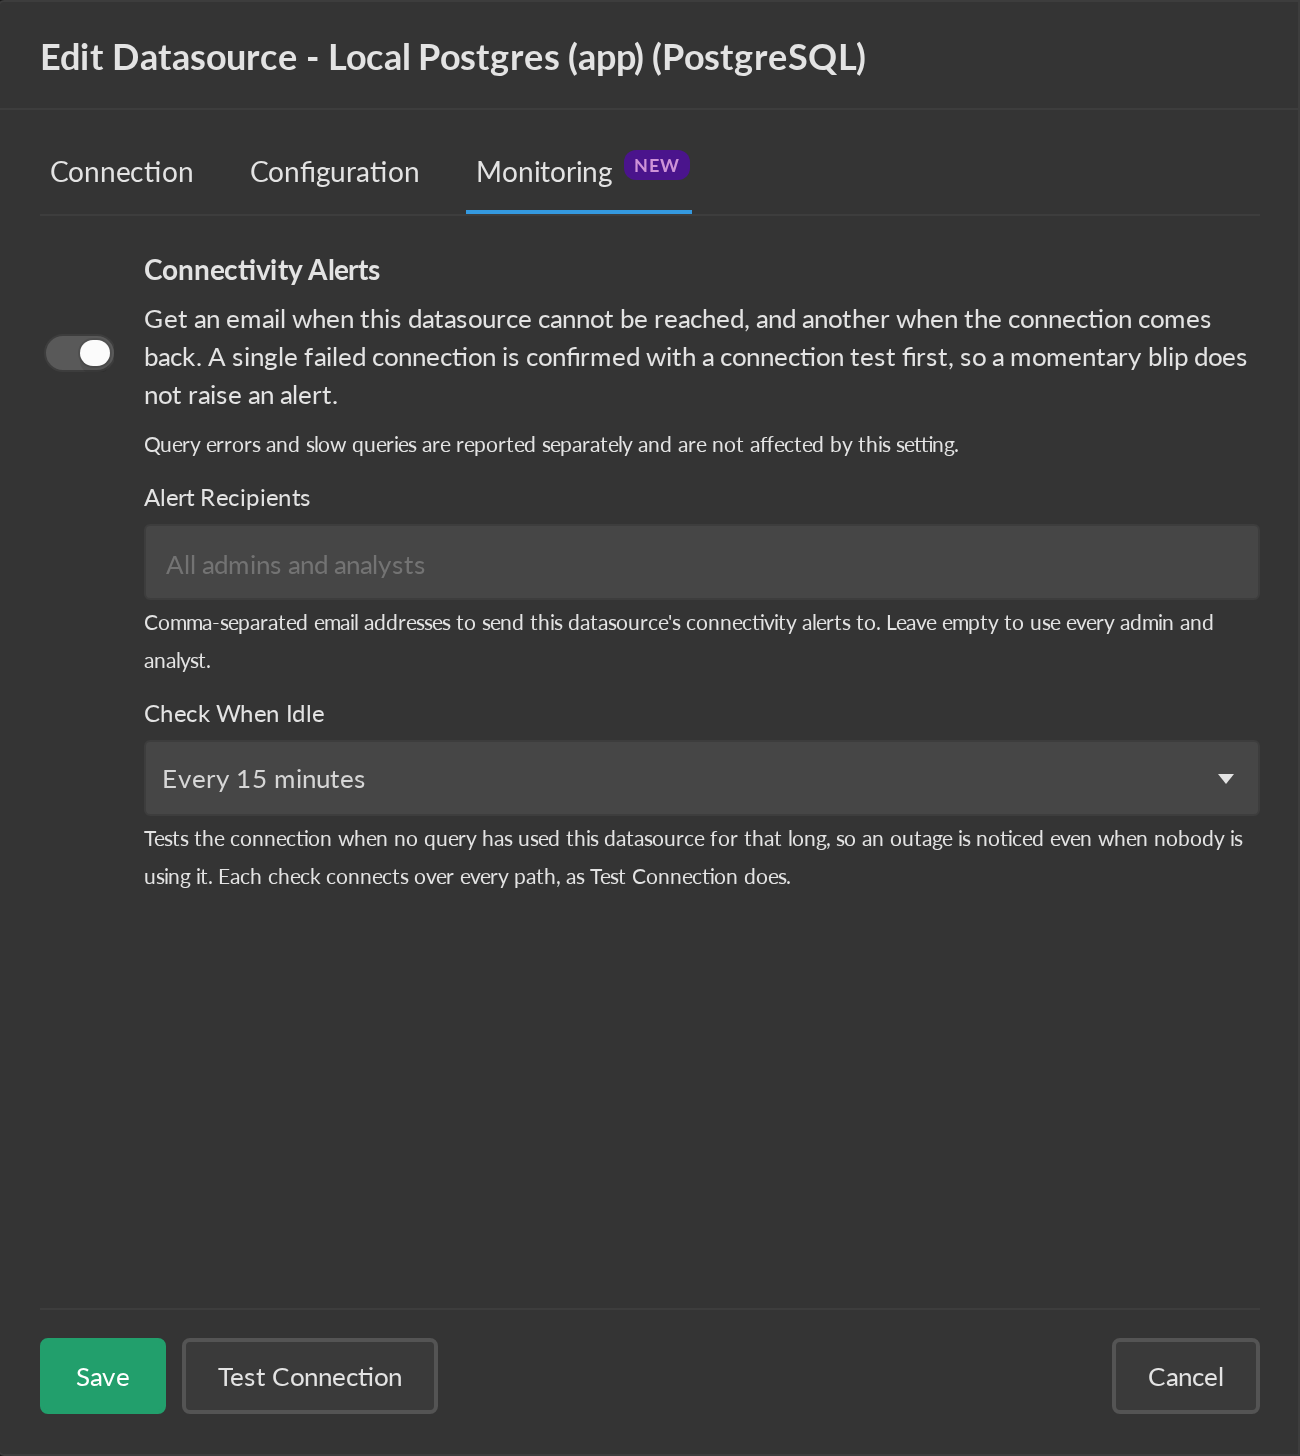
- Alert on connectivity failures: turn alerting on or off for this datasource.
- Alert Recipients: leave empty to email every admin and analyst. Enter comma-separated addresses — an on-call address, for example — to send this datasource's alerts there instead.
- Check When Idle: Off by default. Choose every 5, 10, 15, 30 or 60 minutes to test the connection when no query has used the datasource for that long. Each check connects over every path, as Test Connection does, so your database sees these connections. On Athena, each check also runs a query and writes its result to your S3 output location.