Add interactive filters to a dashboard
You want the people looking at your dashboard to change what it shows —
pick a region, narrow the date range, switch the granularity — without
editing SQL or asking you for a new report. That's what filters are
for. This guide goes from a hard-coded WHERE clause to a working
filter bar.
What you'll end up with
A row of controls at the top of the dashboard. Each control is bound to a variable name; every report whose SQL mentions that variable re-runs when the control changes. Reports that don't mention it are left alone.
Steps
1. Reference a filter variable in a report's SQL
Filters are activated from SQL, not from a settings page. Replace the hard-coded condition with a curly-brace expression naming the variable you want:
SELECT date_trunc('day', created_at) AS day, count(*) AS signups
FROM users
WHERE
  {created_at=timerange} AND {state=customer_state}
GROUP BY day
ORDER BY day
{created_at=timerange}uses the built-in timerange filter — available in any query with no setup.{state=customer_state}names a variable Cluvio hasn't seen before, which creates a custom filter.
Save the report and both controls appear in the filter bar.
customer_state starts life as an ad hoc filter: a multi-select
text input with no definition behind it. It works, but your users have
to know the values and type them exactly. Step 2 fixes that.
See Filter SQL Syntax for the three expression forms and when each applies.
2. Create a definition for the filter
On the dashboard, open the filter bar and click the filter's name
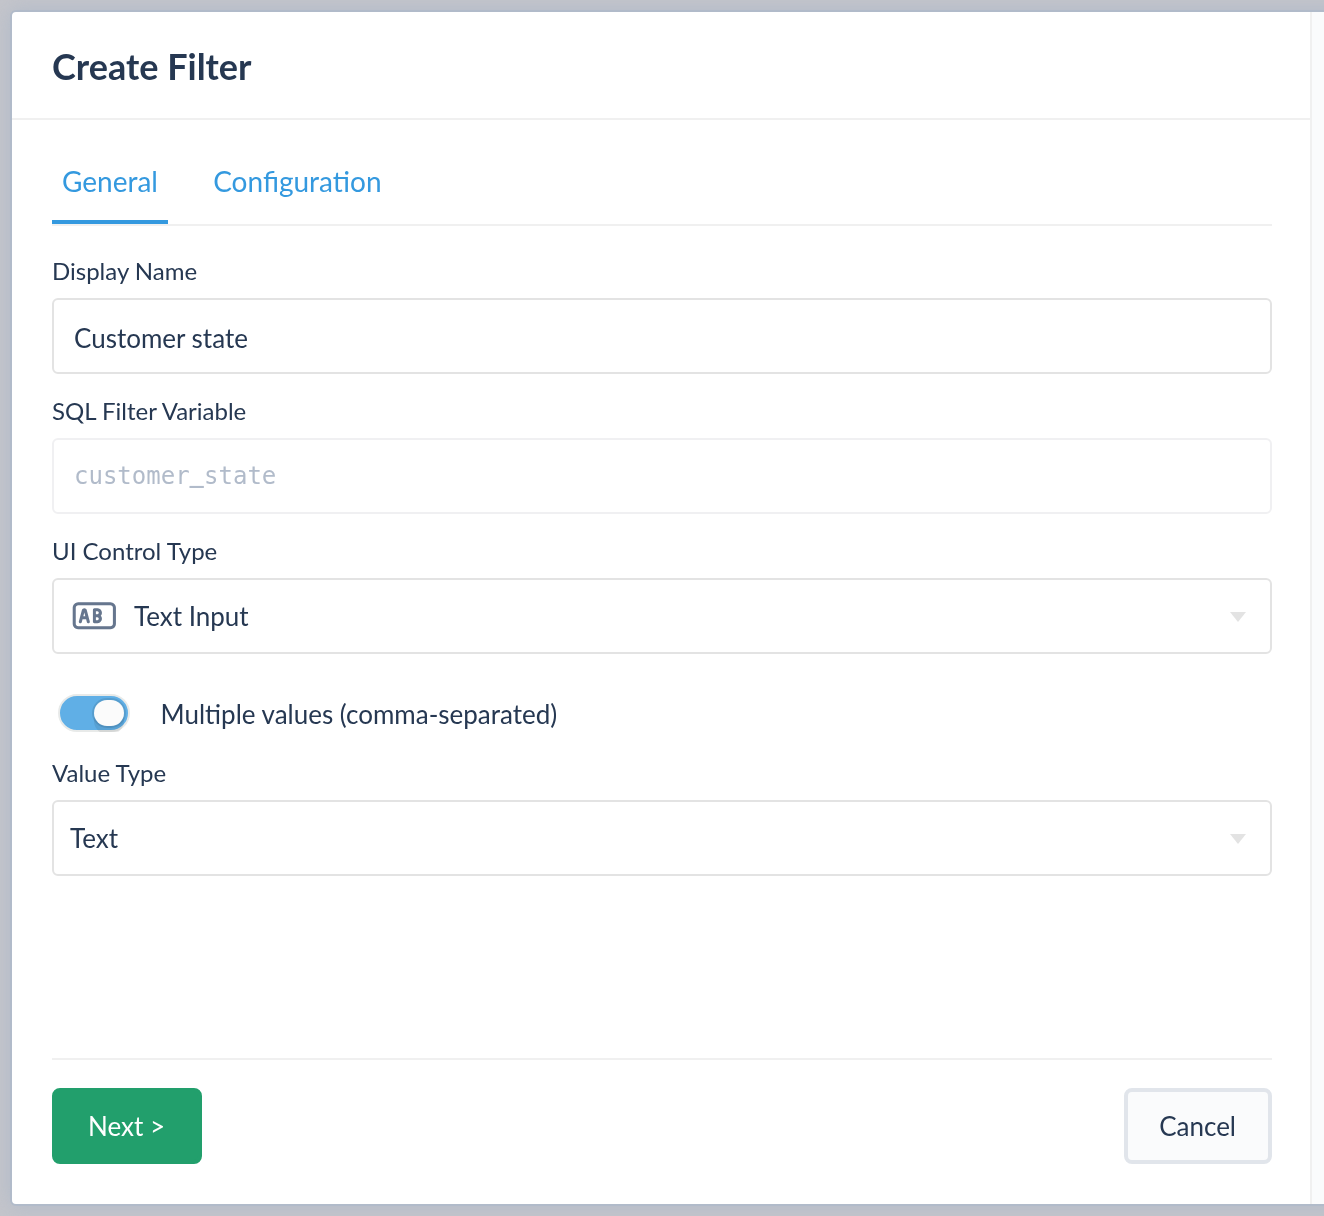
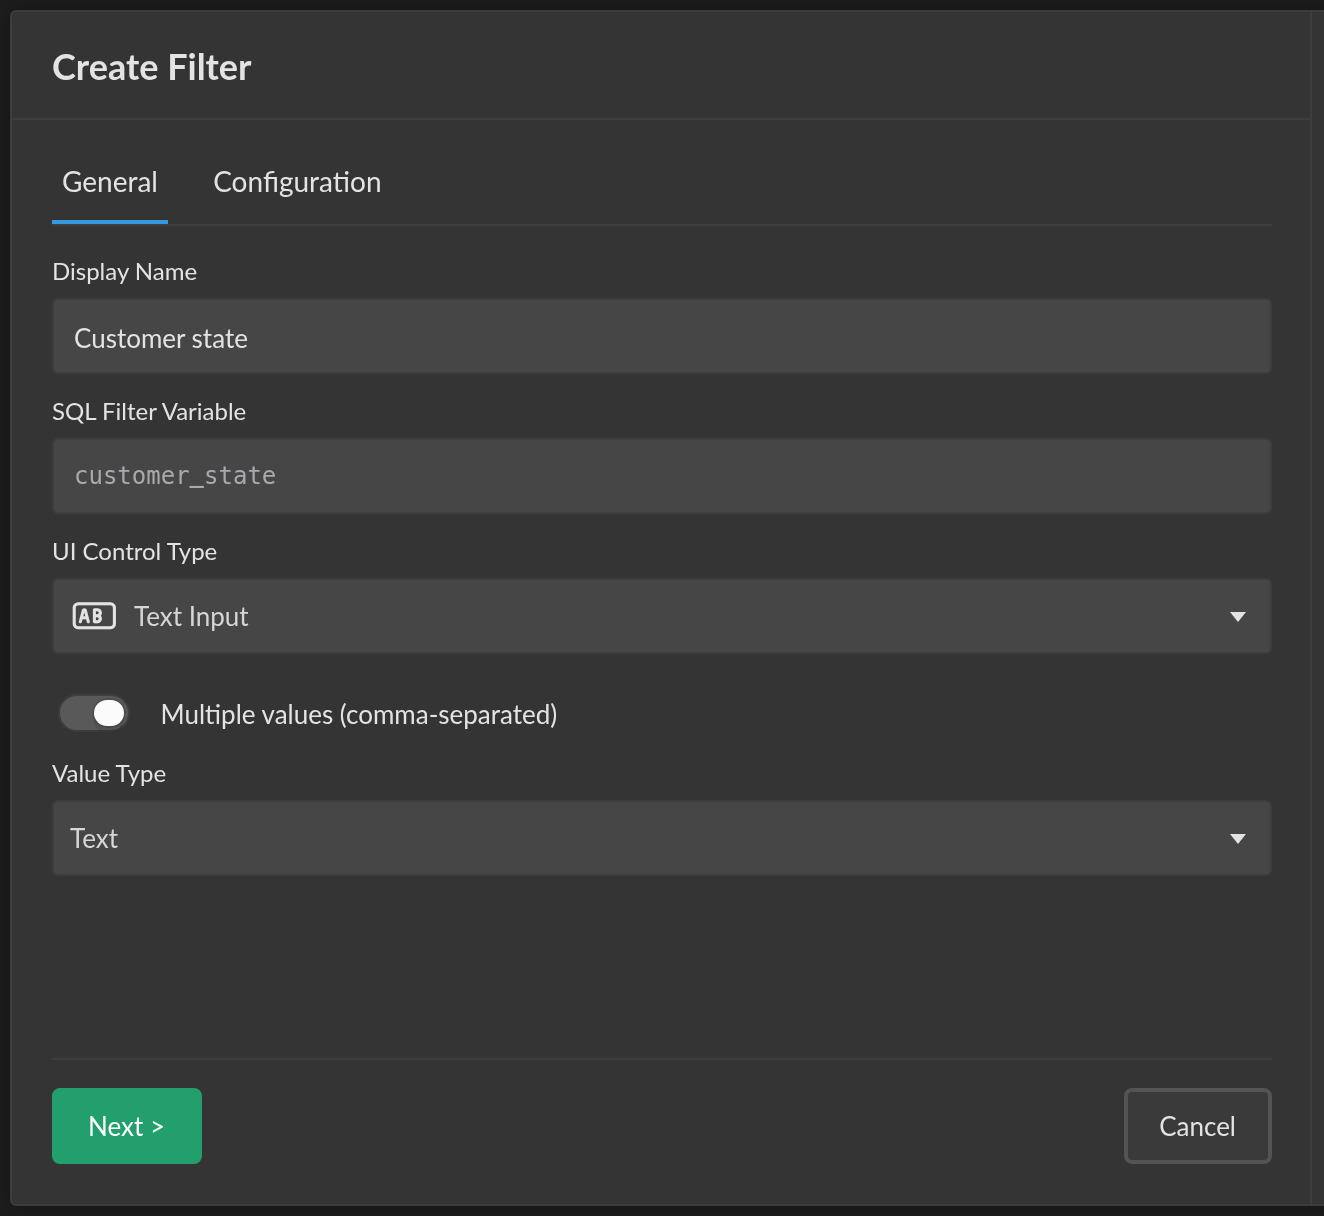
(the label, not the input). The Create Filter dialog opens with
SQL Filter Variable already set to customer_state and locked — it
comes from your SQL, so there is nothing to get wrong. Clicking the name
of a filter that already has a definition opens the edit dialog
instead.
You can also go to Filters in the sidebar and choose Add Filter, which lets you define a filter before any report references it. That route leaves the variable empty and required, and what you type has to match your report SQL exactly — otherwise the definition applies to some other variable and your report keeps its ad hoc filter.
The built-in names timerange, aggregation and tz, and their
variants, are reserved and can't be used for a custom filter.
Two more fields decide how the filter behaves:
- UI Control Type — the control your users see. Step 3.
- Value Type — how the values are quoted when they are written
into SQL. It has to match the column: Text for
varchar, Number for numerics, Date forDATE/TIMESTAMP. A mismatch here is the usual reason a filter errors, or silently matches nothing.
Display Name is cosmetic — the label users see in the filter bar. It
starts as a readable form of the variable, so customer_state arrives as
Customer state; changing it leaves the SQL untouched.
3. Pick the control that fits the column
| Column holds | Use | Why |
|---|---|---|
| A known, smallish set of values (status, region, plan) | Drop-down List | Users choose instead of typing. Options can come from your data — step 4. |
| Free-form text you want searched | Text Input | Accepts several comma-separated values. |
| A boolean | Yes/No/All or Checkbox | Yes/No/All adds an explicit "don't filter" state; a checkbox is on/off. |
| A date or timestamp | Date, Date Range, Date-Time, Date-Time Range | The range controls replace a hand-rolled from + to pair. |
A TIME column | Time, Time Range | Clock times with no date attached. |
Granularity is the odd one out: a date/time aggregation filter doesn't filter rows, it rewrites the grouping expression. Those use a colon rather than an equals sign:
SELECT {created_at:aggregation} AS period, count(*)
FROM users
GROUP BY period
4. Populate a drop-down from your data
Pick Dropdown as the control type, then open the Drop-down Options
tab and choose Dynamic SQL. Select the datasource and write a query
whose first column supplies the values; an optional second column
supplies the labels shown to users.
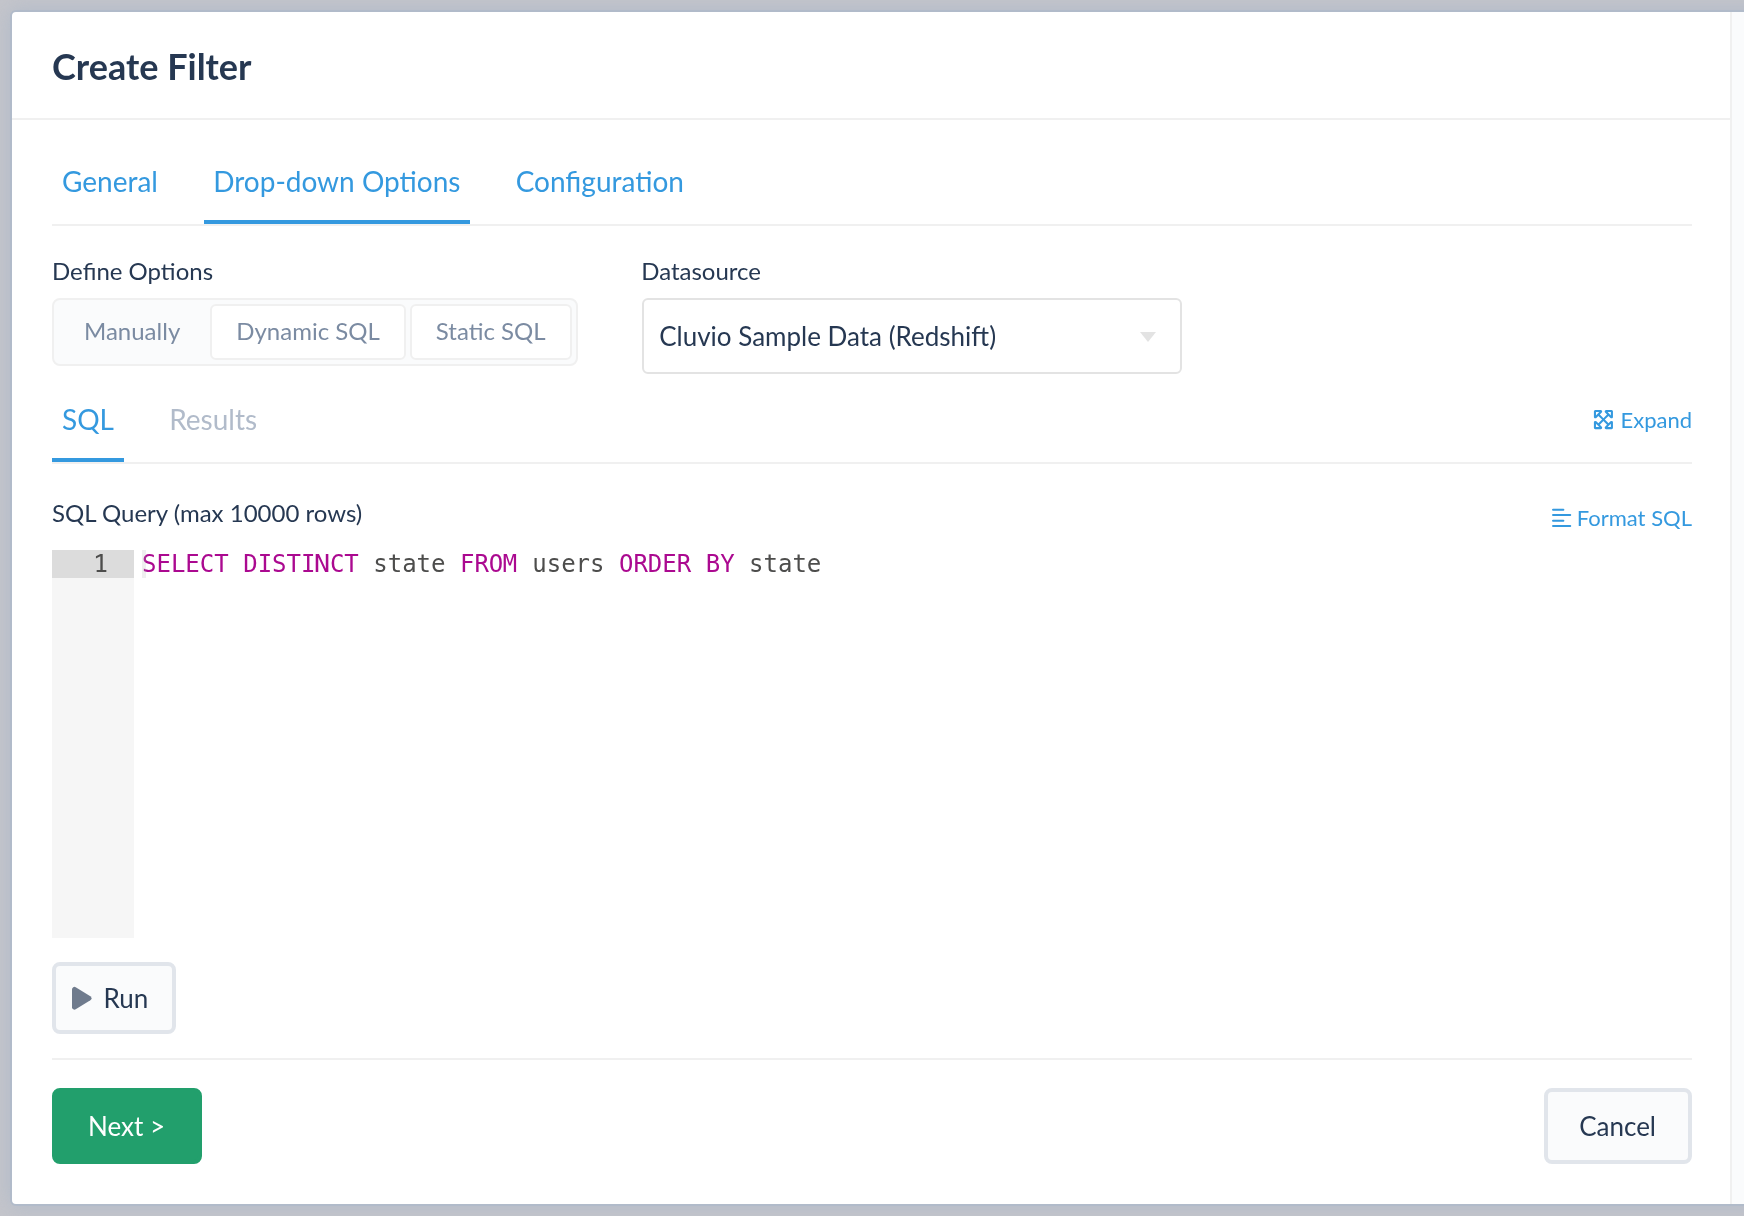
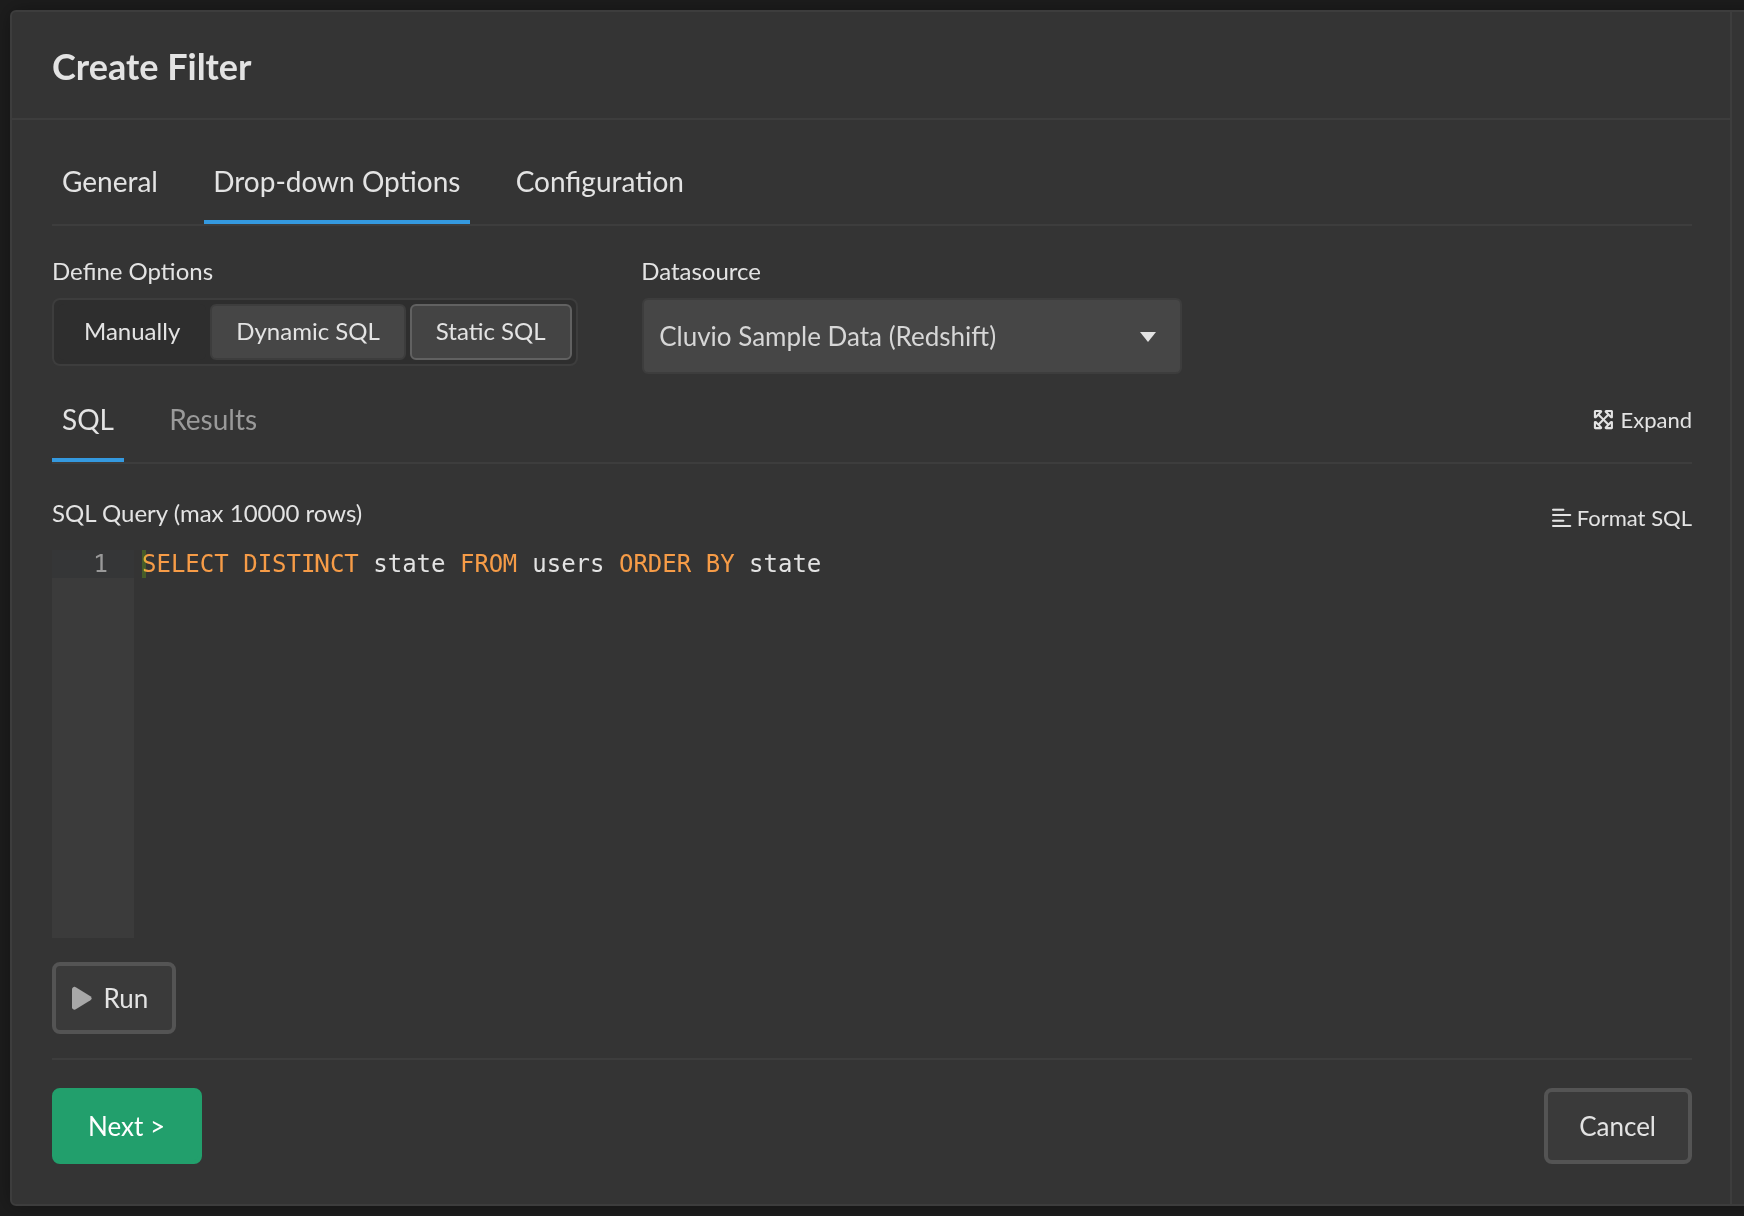
SELECT DISTINCT state FROM users ORDER BY state
- Run executes the query; the Results tab shows what came back, so you can check the list before saving.
- Set a Data refresh rate — anywhere from every 15 minutes to once a day, or manual-only — so new values appear as your data grows.
- Use two columns when the stored value isn't human-readable:
SELECT id, name FROM regions ORDER BY name. - Prefer Dynamic SQL. Its query can reference other filters, so a drop-down can depend on several of them at once — pick a country, get that country's cities. Static SQL can't use filters in its query; it can only nominate one other filter as a static parent.
5. Give the filter a default value
Default Values are pre-selected the first time someone opens the
dashboard. This matters for more than convenience: a filter with nothing
selected doesn't filter at all — a condition expression collapses to
1=1 and every row passes. On a large table that makes the first load
an unfiltered scan.
Pick a default that's both useful and cheap — last 30 days, your largest region — and the dashboard opens fast on something meaningful.
6. Apply the filter to every report that should react
A filter drives a report only if that report's SQL references its variable. Add the same expression to each report you want it to control.
To check coverage later, use Find Usages from the filter's actions menu on the Filters page — it lists every report referencing the variable, which is also what you want before you rename or delete anything.
Removing a filter definition leaves the {...} references in your
reports. They keep working, but the filter reverts to ad hoc behaviour —
a plain text input with no options and no defaults.
7. Try it on the dashboard
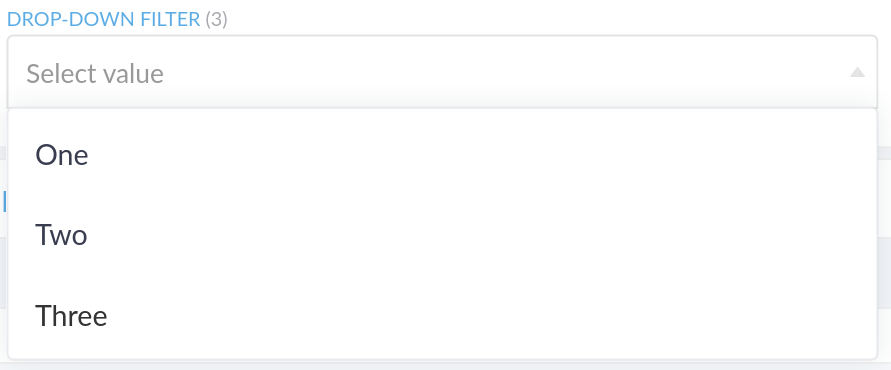
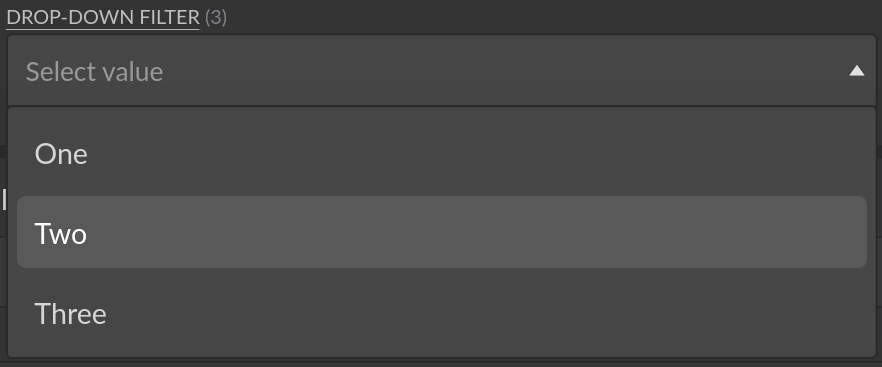
Open the dashboard, change the control, and confirm the right reports re-run. If one doesn't move, its SQL is missing the variable (step 6). If a report errors, check the Value Type against the column type (step 2) — and Investigate query errors will show you the Executed SQL with the values substituted in.
Tip — filters travel in the URL
Filter selections are part of the dashboard URL, which is why a sharing link can open pre-filtered, and why an embedded dashboard can be driven from your own application's controls. If you're embedding, that's the whole mechanism behind Embed with your own filter controls.
Related
- Reference: Filters — every control type, value type and expression form.
- Reference: Drop-down List — manual, dynamic-SQL and static-SQL options in detail.
- How-To: Embed with your own filter controls — drive these filters from your product's UI.
- How-To: Embed a dashboard scoped per customer — lock a filter to a value your backend chooses.