Investigate query errors
A report shows an error instead of a chart, or dashboard monitoring has just e-mailed you about query failures. This guide takes you from "something is erroring" to "here's the line to fix".
Steps
1. Open the right Query Errors list
There are two places to look, depending on what you know:
- You know the datasource — go to Datasources, click the sparkline next to the affected datasource (or open it and select Performance & Insights), then switch to Query Errors. This covers every query on that datasource.
- You know the dashboard — if the dashboard is monitored, open its Performance & Insights tab and switch to Query Errors there. The list works identically but is scoped to that dashboard's own queries. See Monitor your most important dashboards.
Both lists cover reports, filters and SQL alerts, so failures nobody was watching — a drop-down's options query, a scheduled alert — show up here too.
2. Group by error message to find the one that matters
By default the list shows individual errors, newest first. Click Group Same Error Message to collapse them by message, sorted by Count descending.
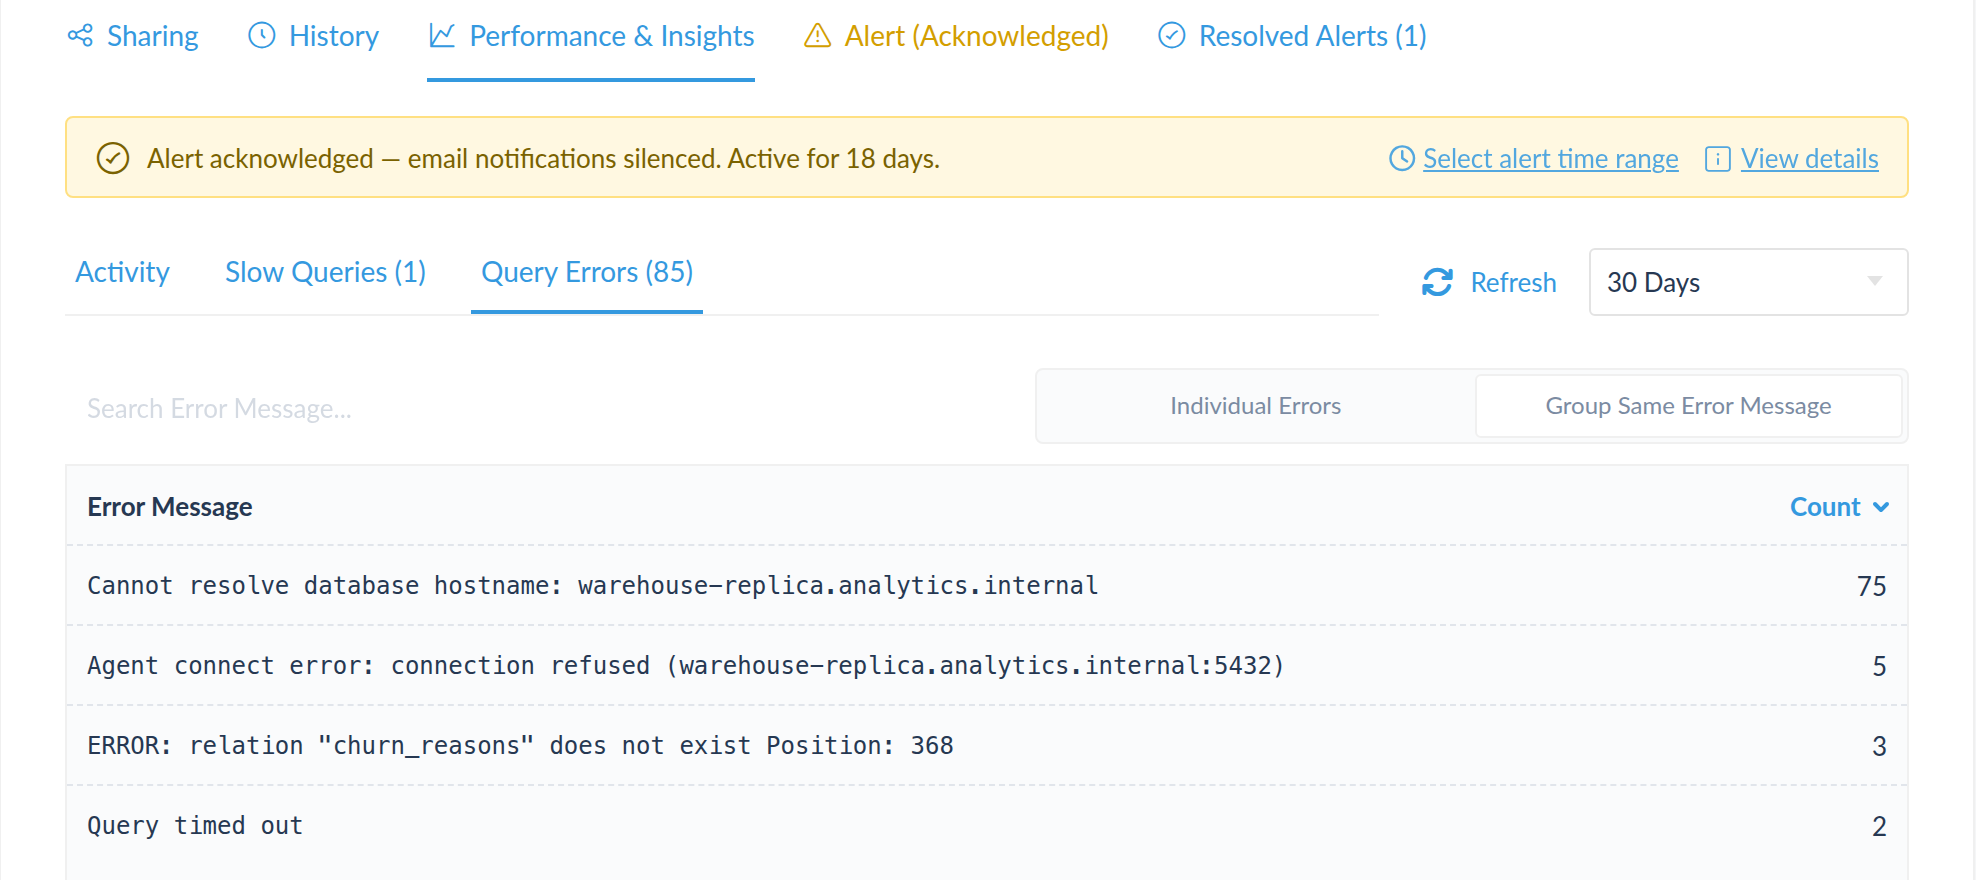
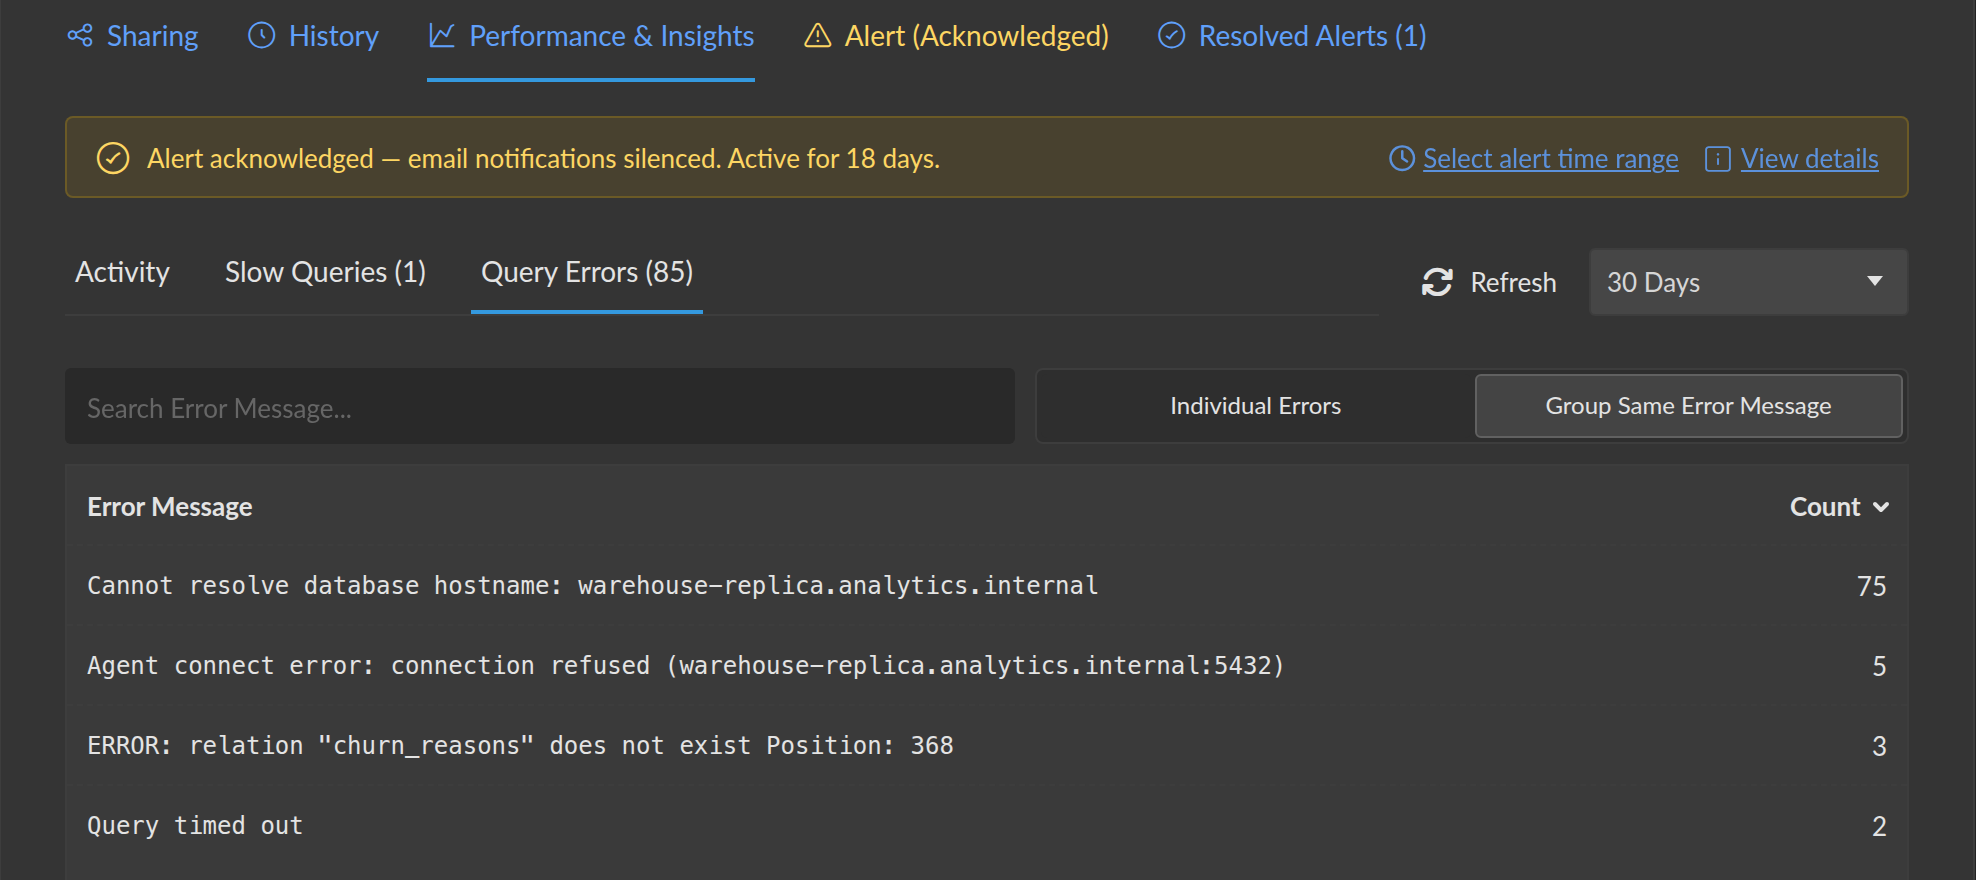
One broken query usually produces many rows, so the grouped view tells you how many distinct problems you actually have. Start at the top: the most frequent error is affecting the most people.
Use the time range selector in the top-right to widen or narrow the window — the default is 7 Days.
3. Discount the retries
Rows badged RETRY are automatic retries of a query that already
failed. A failed query is retried up to 5 times consecutively within
an hour, so a single broken report can account for six rows in the
list.
Read the counts as executions, not as problems. A group of 10 with
RETRY on most rows may be one report failing twice.
4. Open the error to see what actually ran
Click an error message to open its detail view.
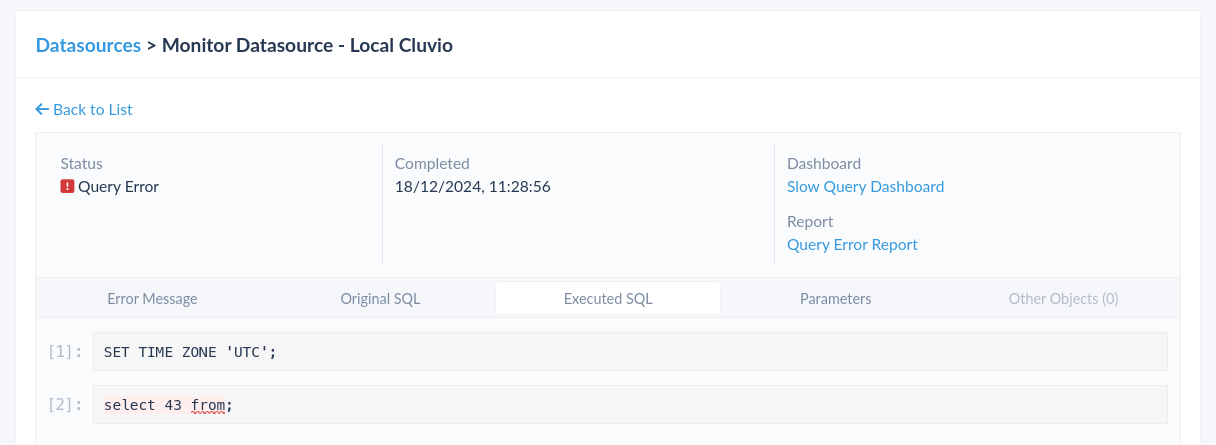
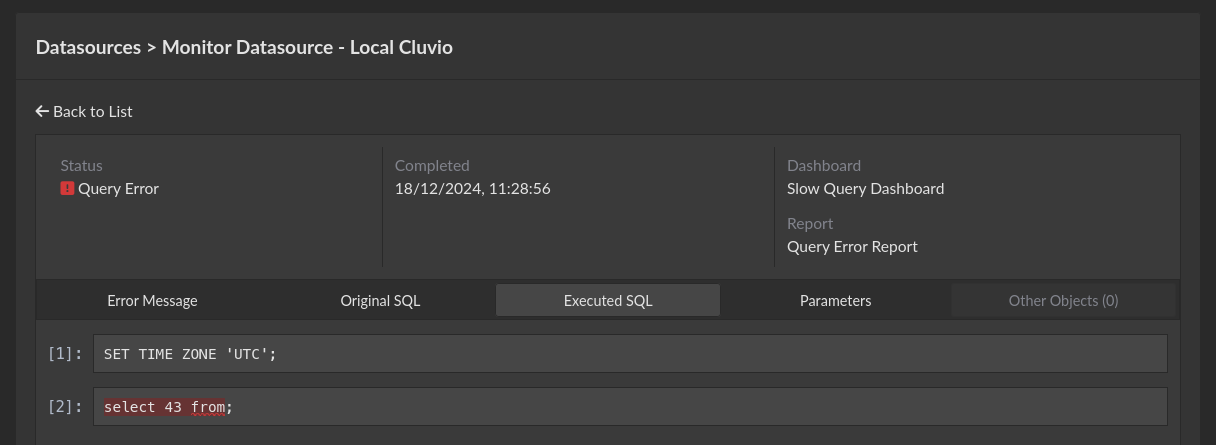
The top half tells you what triggered the query — the report, filter or SQL alert, and for a report the dashboard it lives on — with the full error message your database returned beneath it. Four tabs hold the rest:
- Executed SQL — what Cluvio actually sent, after expanding SQL snippets, substituting filter values, and applying time-zone settings and plan result limits. Syntax errors are highlighted here. This tab opens first.
- Original SQL — the query as it appears in the report, filter or alert editor.
- Parameters — every filter value bound in this run.
- Related Objects — reports, filters and alerts that share the same original SQL, and are therefore probably broken too.
Copy the Executed SQL — not the Original SQL — when you want to reproduce the failure in your own database client. The Original SQL still contains Cluvio's curly-brace expressions and won't run as-is.
5. Match the message to a cause
| The message looks like | Usual cause | Where to fix it |
|---|---|---|
syntax error at or near … | The Executed SQL isn't valid for this database — hand-edited SQL, or a value expression used where a full condition was expected. | The report SQL. The highlight in Executed SQL marks the position. |
relation … does not exist | The table was renamed or dropped, or the user Cluvio connects with can no longer see it. | Your query, or the grants — see Creating a read-only user. |
permission denied for … | Cluvio's read-only user lacks rights on a table or schema that was added later. | GRANT SELECT in your database. |
Agent connect error | Your database is not reachable through the agent. | The agent host — see Using Cluvio Agents. |
| Timed out, cancelled | Not a query error to fix here — the query ran too long to finish. | Investigate a slow query. |
If the same message appears against several unrelated reports, check Related Objects on one of them first — you may be looking at one shared SQL snippet or filter rather than several broken reports.
6. Confirm the error is gone
Re-run the affected report, then come back to Query Errors with the
30 Minutes or 60 Minutes range selected — those refresh
automatically, marked with a LIVE badge — and check that no new
occurrences arrive.
If the dashboard is monitored, its alert clears itself after 30 minutes of successful queries with no errors and no slow queries; you don't have to resolve it by hand.
Tip — an empty filter is not an error
A filter with nothing selected doesn't fail. A condition expression
{column=variable} becomes 1=1, so every row passes. If a report is
returning everything rather than erroring, you're looking at a filter
default, not a query error — see
Filters → Default Values.
Related
- Reference: Performance & Insights → Query Errors — every field in the list and the detail view.
- How-To: Investigate a slow query — the same tooling, for queries that finish but take too long.
- How-To: Monitor your most important dashboards — get e-mailed about these errors instead of finding them.