Investigate a slow query
A dashboard is loading slowly, or a report is timing out, and you want to know why. This guide takes you from "something's slow" to "here's what to do about it".
Steps
1. Open the datasource's Performance & Insights tab
From the Cluvio sidebar, go to Datasources, then click the sparkline next to the affected datasource (or click into the datasource and select Performance & Insights). You land on the Activity tab.
If you're not sure which datasource the slow query is on, open the report and check its datasource at the top of the editor.
2. Confirm the slowdown is real, and when it started
The Activity tab shows three complementary charts:
- Running Concurrently — currently-running queries colour-coded by elapsed time. Orange and red bars are the slow ones; purple bars are queued behind the concurrency limit.
- Completed — query completions over time, colour-coded by status (success / error / timed out).
- SQL Duration — minimum, maximum or average duration per bucket; slower durations skew orange / red.
Use the range selector to confirm the slowness is happening now versus an intermittent past spike. The default 7d view is usually enough.
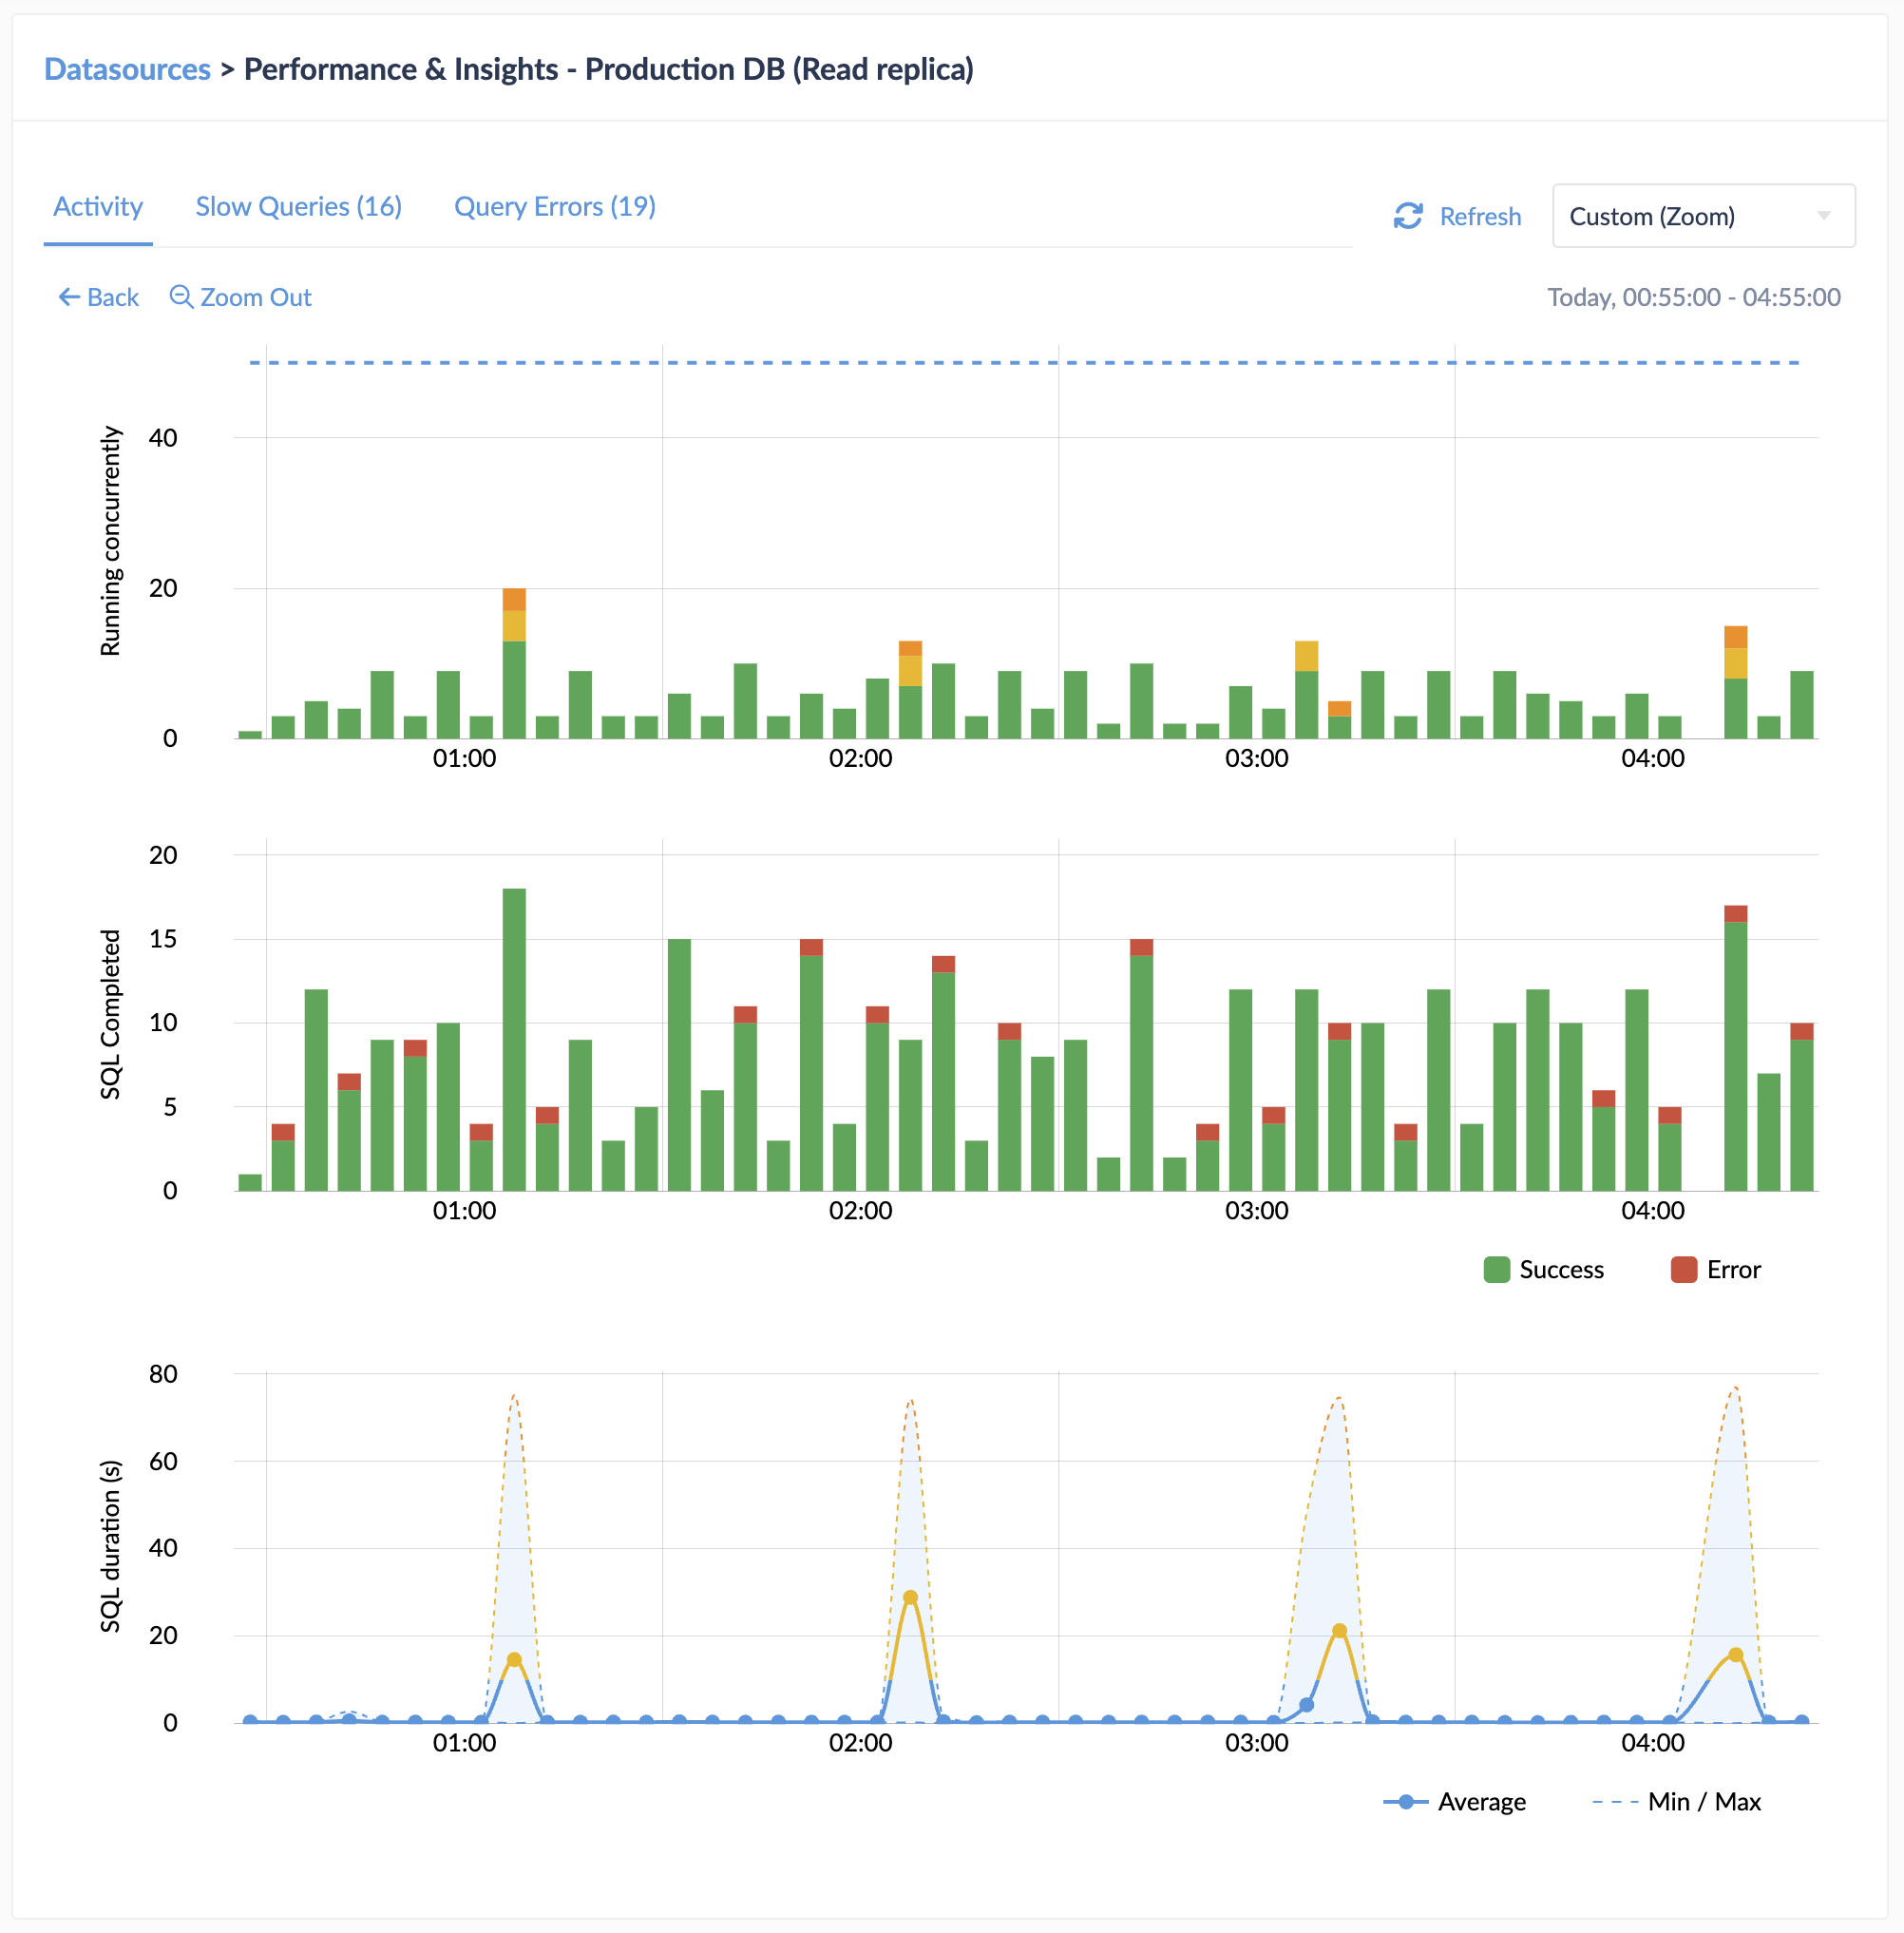
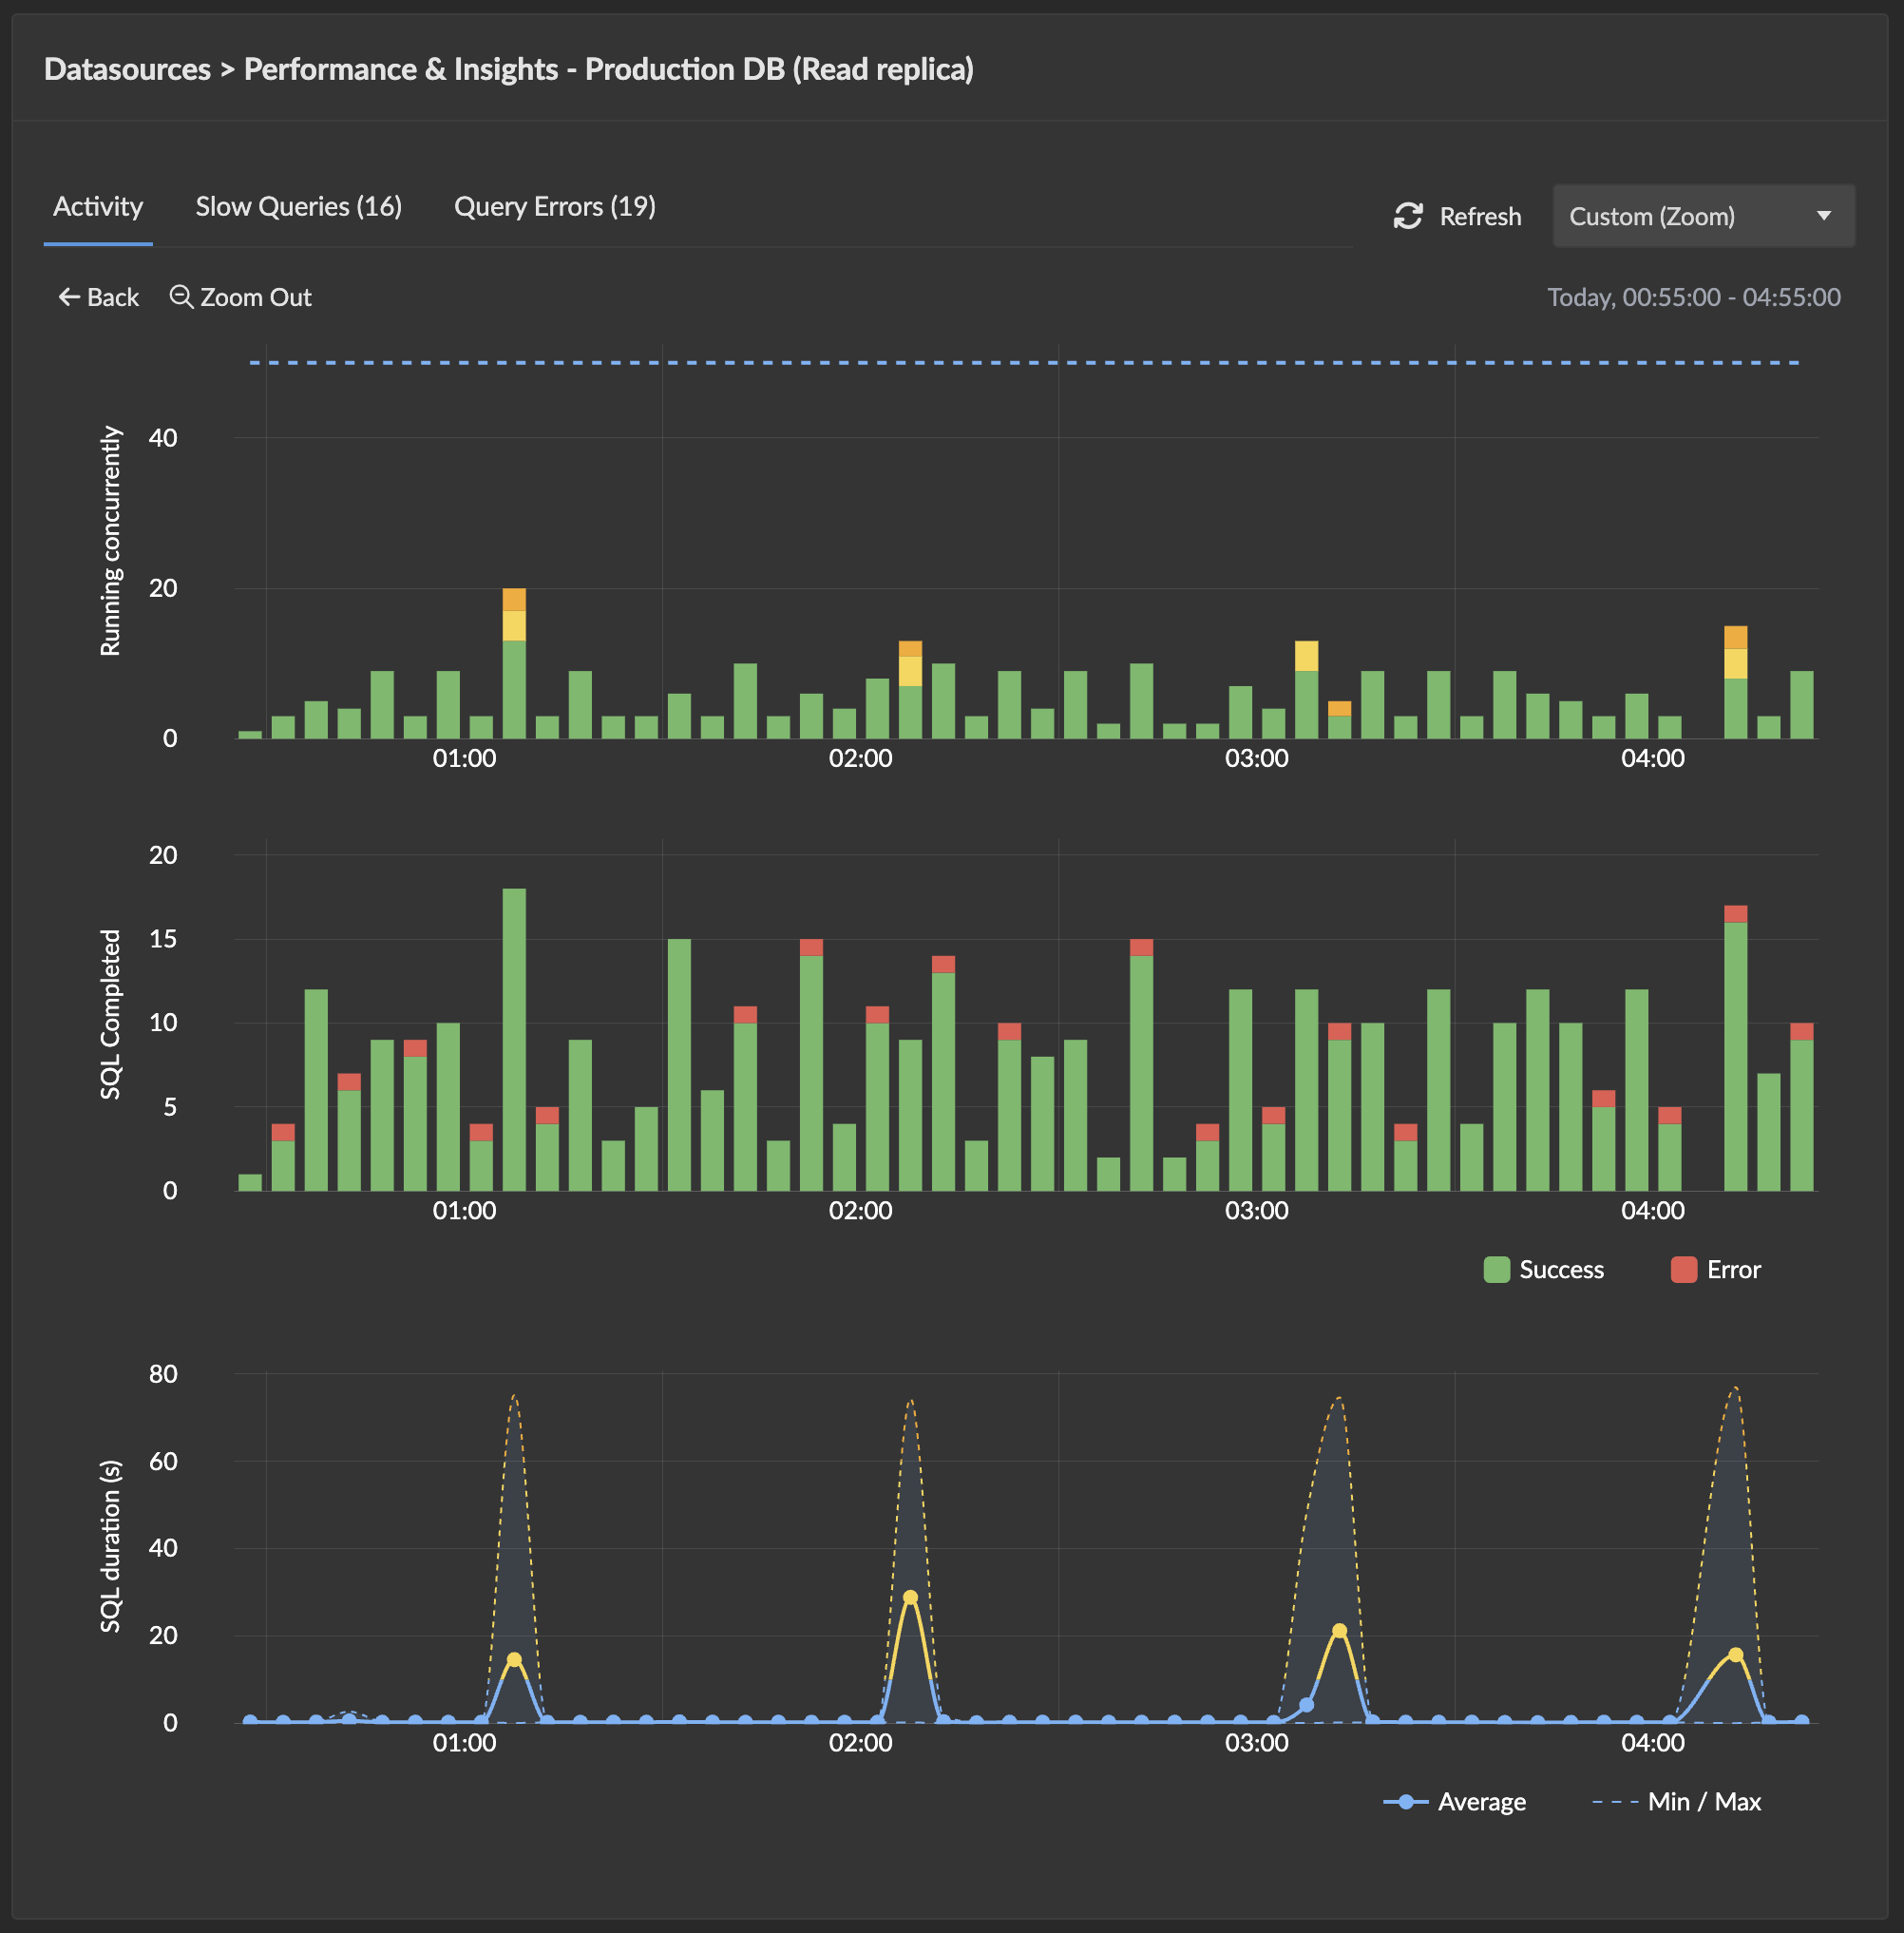
If you see a cluster of red / orange bars or a sudden jump in the SQL Duration chart, you've confirmed it. Note the rough time-of-day the slowdown started.
3. Switch to the Slow Queries tab and group
Switch to Slow Queries. By default everything is sorted by duration (slowest at top), one row per slow execution.
Click Group Same SQL & Filters to collapse identical executions into groups. The sort column changes to Total Duration. The queries that hurt the most — frequent and slow — bubble to the top of the list. Start your investigation with the top group.
4. Open the group detail to see what's running
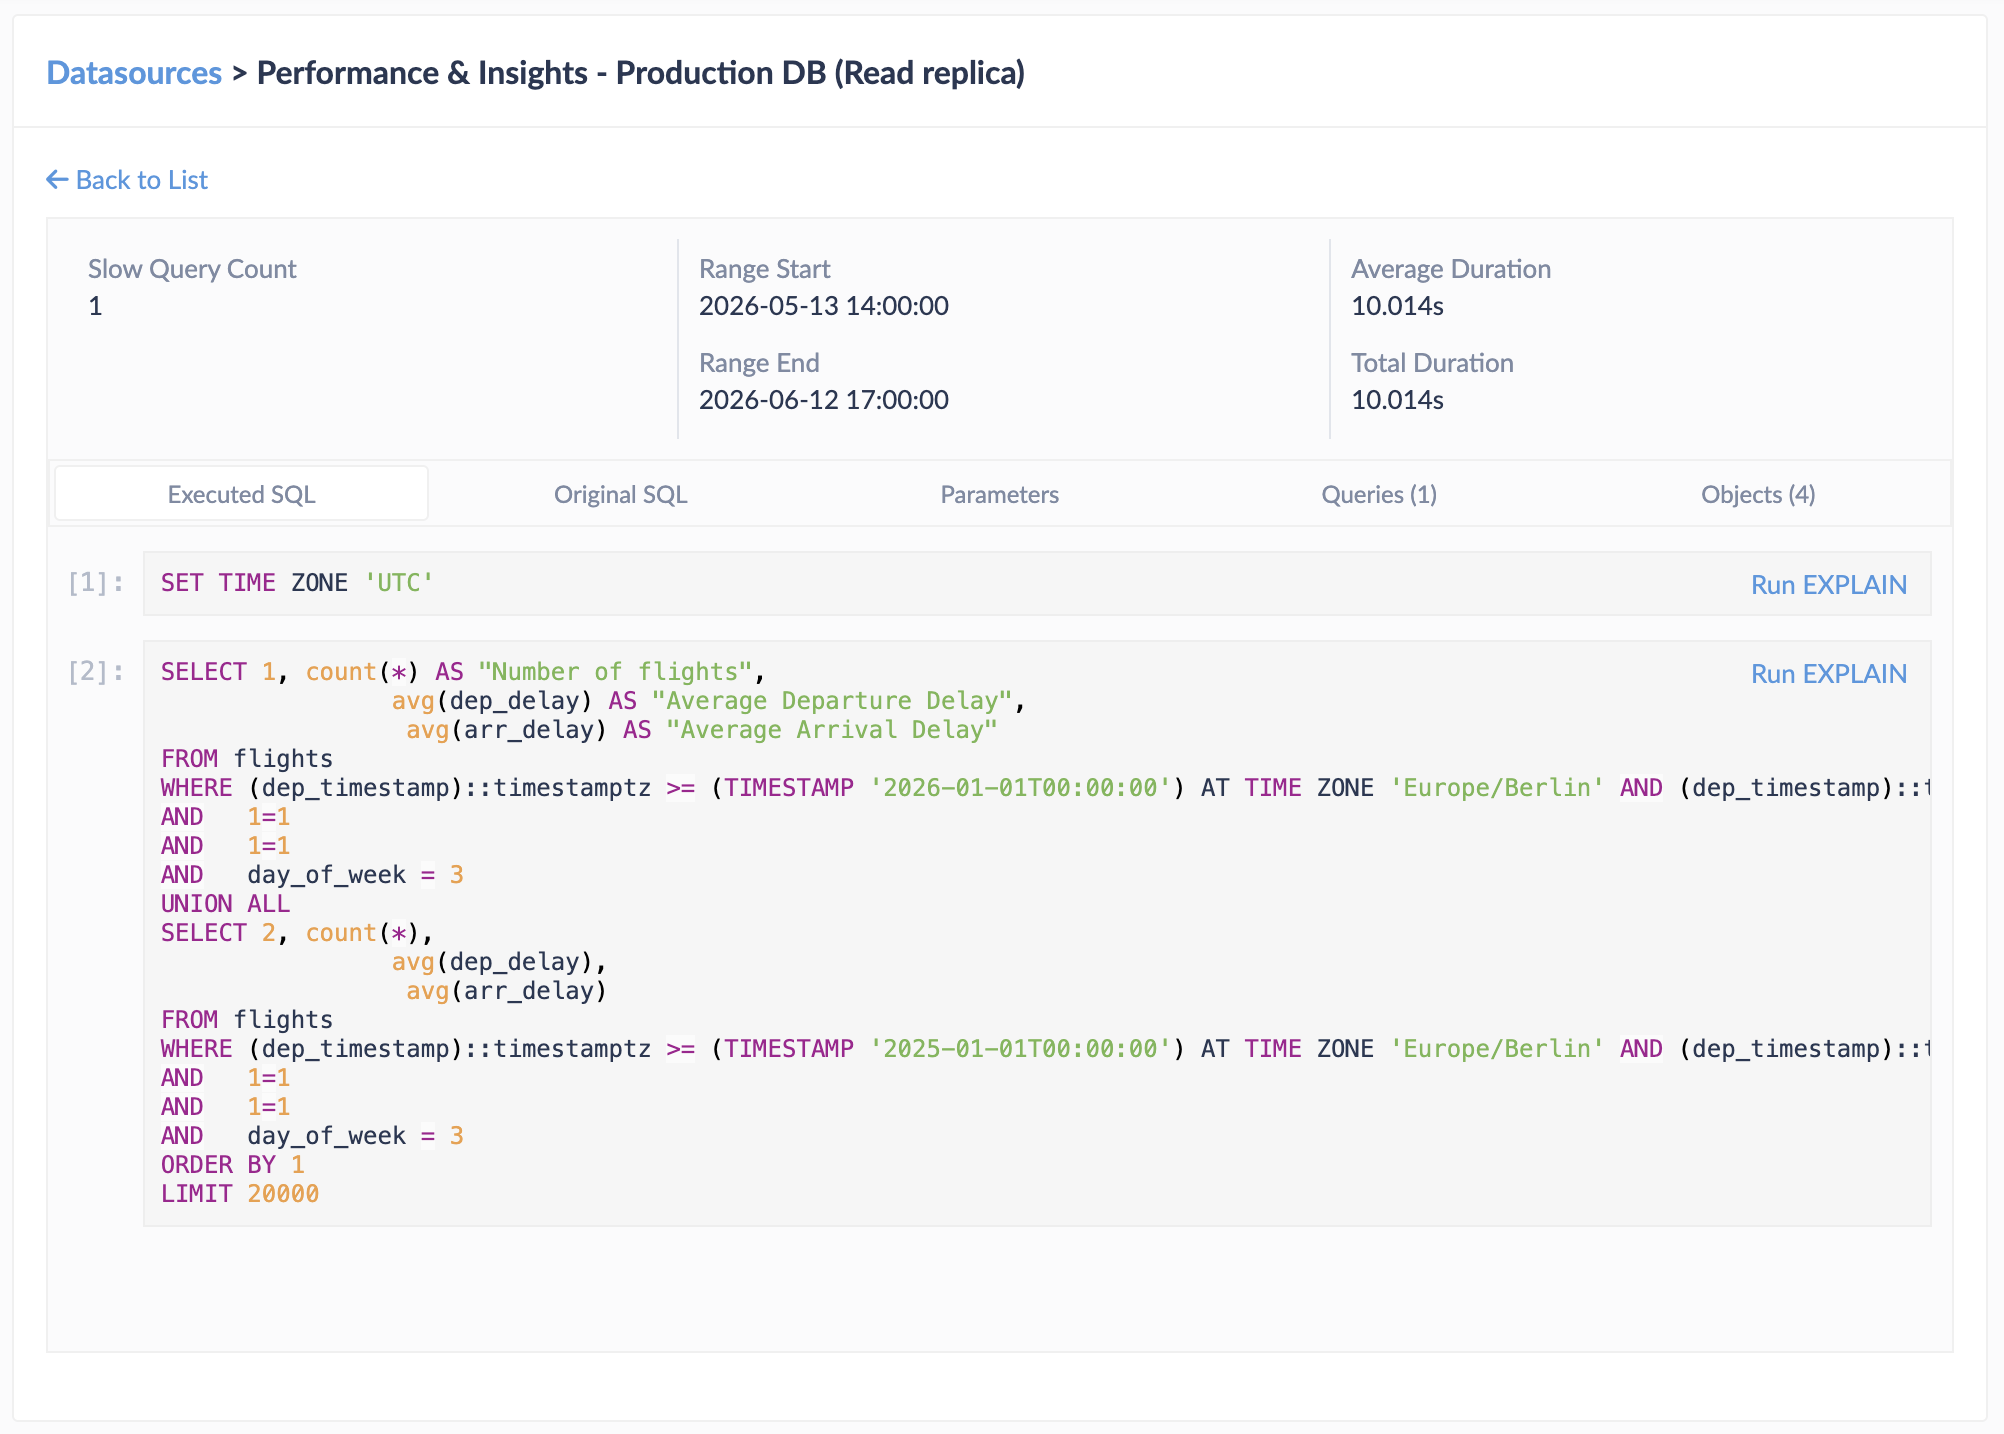
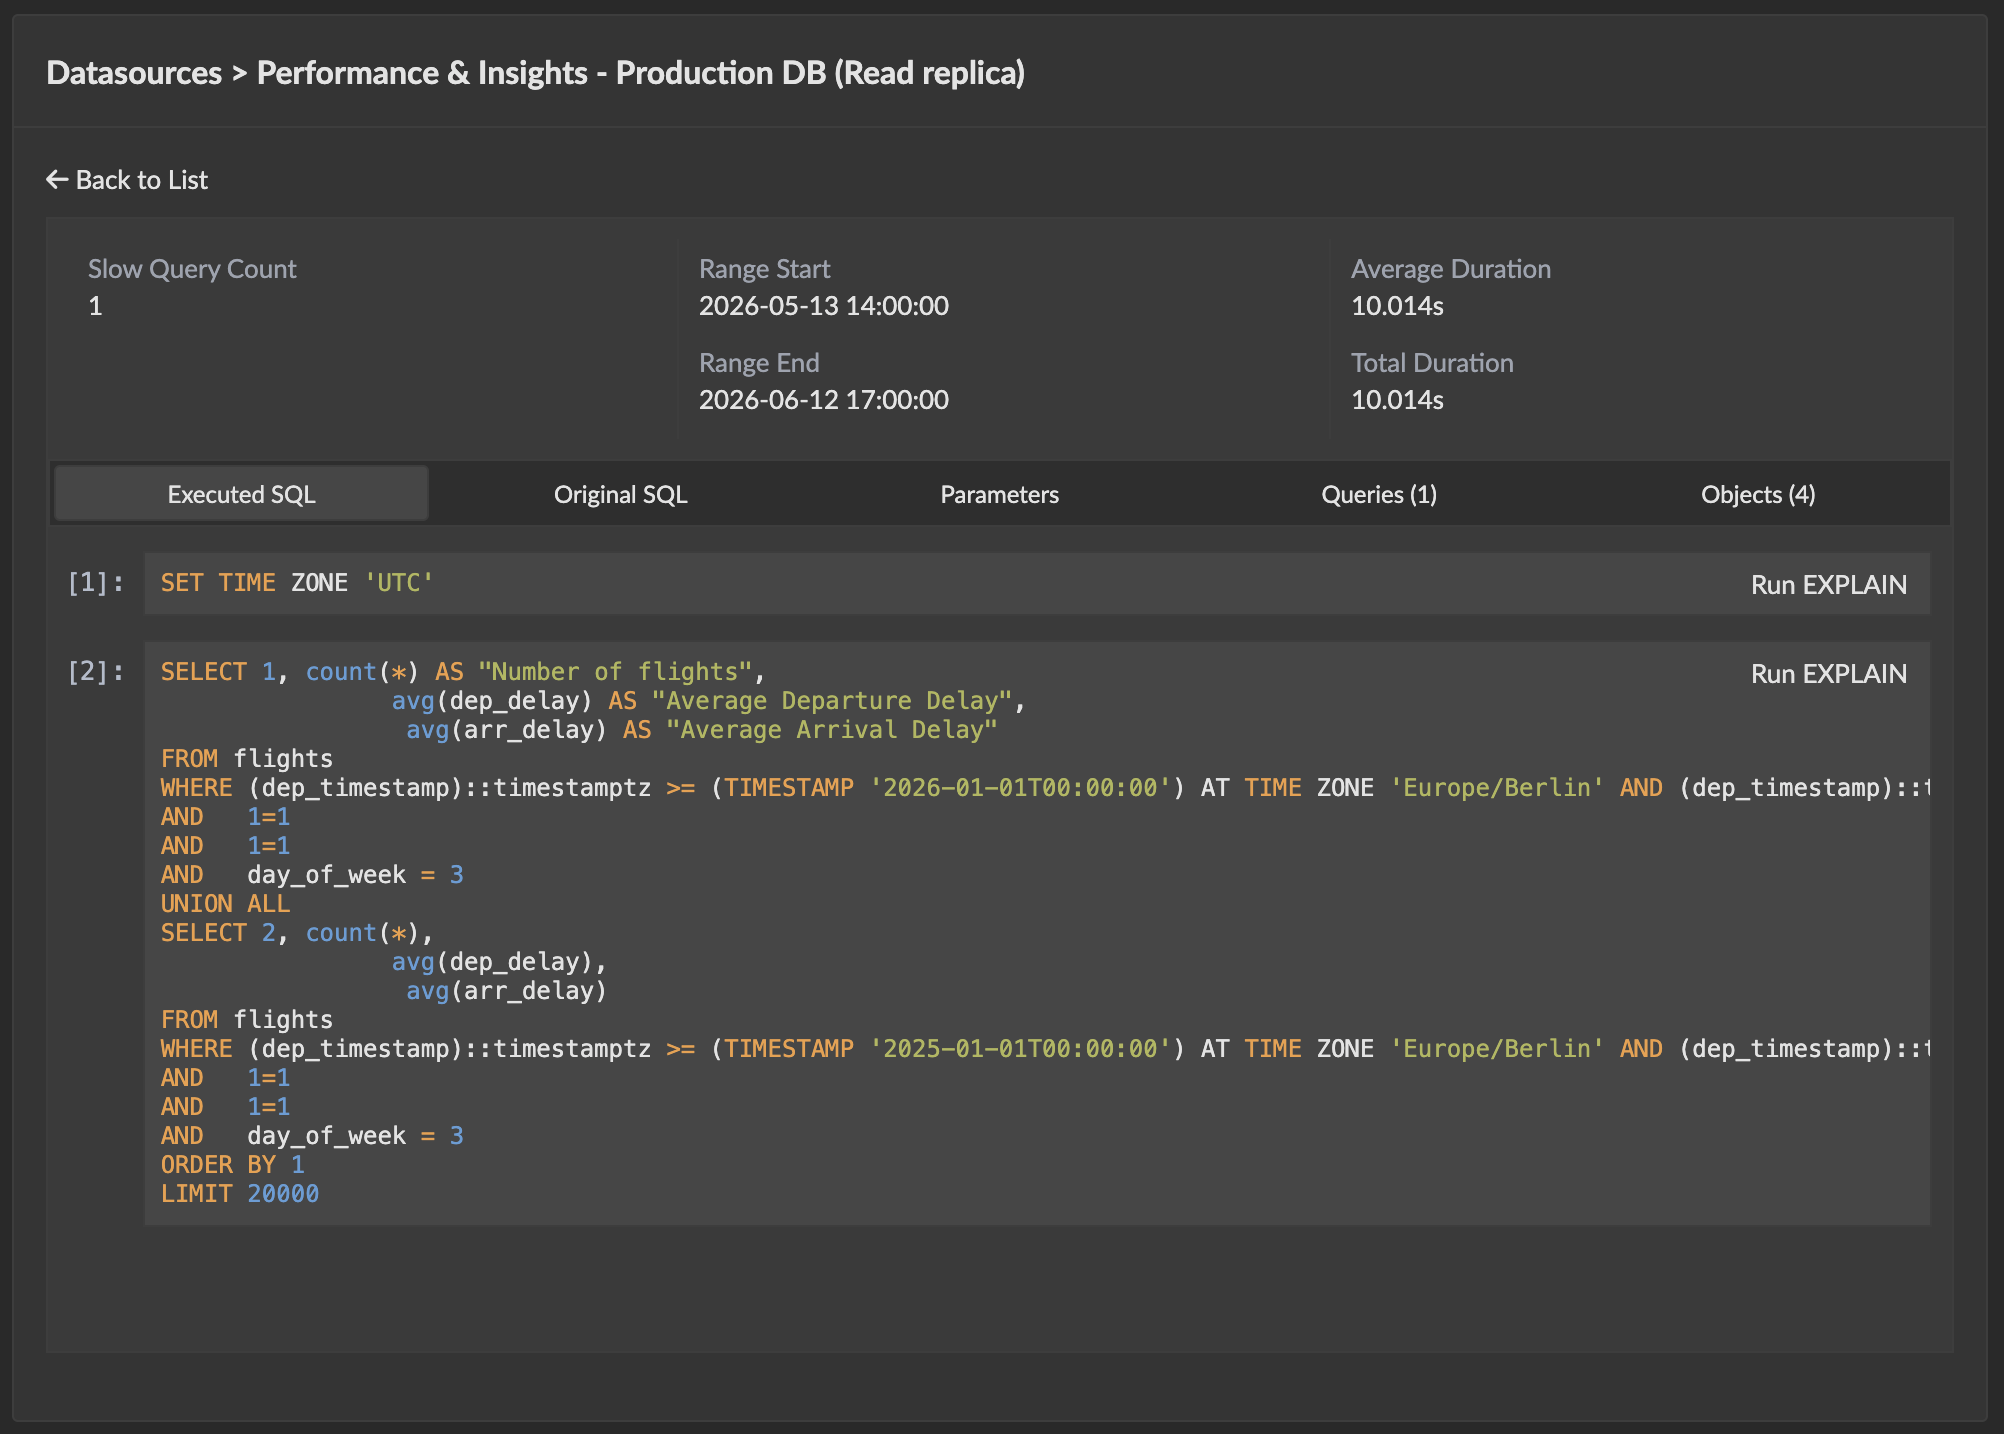
Click into the top group. The detail view shows:
- Original SQL — the query as you wrote it in the report, filter or alert editor.
- Executed SQL — what Cluvio actually sent to the database after expanding SQL snippets and substituting filter values, applying time-zone settings, and applying plan-specific result limits.
- Parameters — every filter value bound in this run.
- Queries — the individual slow executions in the group, so you can spot the time-of-day pattern.
- Objects — every report / filter / SQL alert that shares the Executed SQL. These are all affected by the slowness.
5. Decide what to fix
Take the Executed SQL and run it directly against your database to confirm slowness outside Cluvio. Then choose a remediation:
| Cause | Fix |
|---|---|
| Missing index on a filter column | Add the index in your database. |
| Aggregation over too much data | Pre-aggregate in your data warehouse, or partition / cluster the source table. |
| Query plan re-evaluating per execution | Add a SQL snippet for the expensive sub-query so it's cached at the engine level. |
A few inefficient filters with many ORs | Tighten the filter SQL — narrow the predicate, drop dead branches. |
| Result set too large | Add a LIMIT, paginate, or aggregate before returning. |
| Concurrency saturating the datasource | Stagger refresh rates, raise the maximum concurrency on the datasource, or move to a larger database instance. |
6. Confirm the fix
After you ship a fix, watch the Activity charts in real time (use the
30 Minutes or 60 Minutes range — they auto-refresh, marked
with a LIVE badge). The SQL Duration line should drop, and the
Completed chart should show fewer red / orange bars.
Tip — watch out for retries
The Query Errors tab marks errors as RETRY when they came from
Cluvio's automatic retry of an earlier failure. If the slow query
also produces errors, look there too — what you see as a slow query
might just be the successful tail of a retry loop hiding an actual
failure earlier on. See
Investigate query errors.
Related
- How-To: Investigate query errors — the same tooling, for queries that fail rather than drag.
- Reference: Performance & Insights — full description of every tab and metric.
- Reference: SQL Snippets — for caching expensive sub-queries.
- Reference: Datasources — concurrency configuration.