Monitor your most important dashboards
Some dashboards matter more than others — the ones an executive checks every morning, the ones embedded in your product, the ones a customer sees. This guide sets up Cluvio to watch those dashboards for you and e-mail you the moment their queries start failing or running slow, so you hear about a problem before your stakeholders do.
Dashboard monitoring requires a plan that includes it, and each plan allows a limited number of monitored dashboards. See Pricing.
What you'll end up with
For each dashboard you choose to monitor, Cluvio continuously tracks its query executions. When queries start erroring (or running slower than a threshold you set), an alert is raised, the people you nominate are e-mailed, and surfaces the problem on the dashboard's Alert tab — then auto-resolves the alert once things recover.
Steps
1. Decide which dashboards to monitor
Monitoring is deliberately a per-dashboard opt-in, not an all-dashboards firehose — your plan includes a fixed number of monitored-dashboard slots. Spend them on the dashboards where a silent failure would actually hurt:
- Dashboards embedded in your product or shared with customers.
- Dashboards that drive a recurring decision (the morning numbers).
- Dashboards on a fragile or slow datasource.
You can see how many slots you've used as you go (step 2).
2. Turn on monitoring for a dashboard
Open the dashboard's Settings → Monitoring tab and turn on Dashboard Monitoring. A note shows how many of your plan's monitored-dashboard slots are in use.
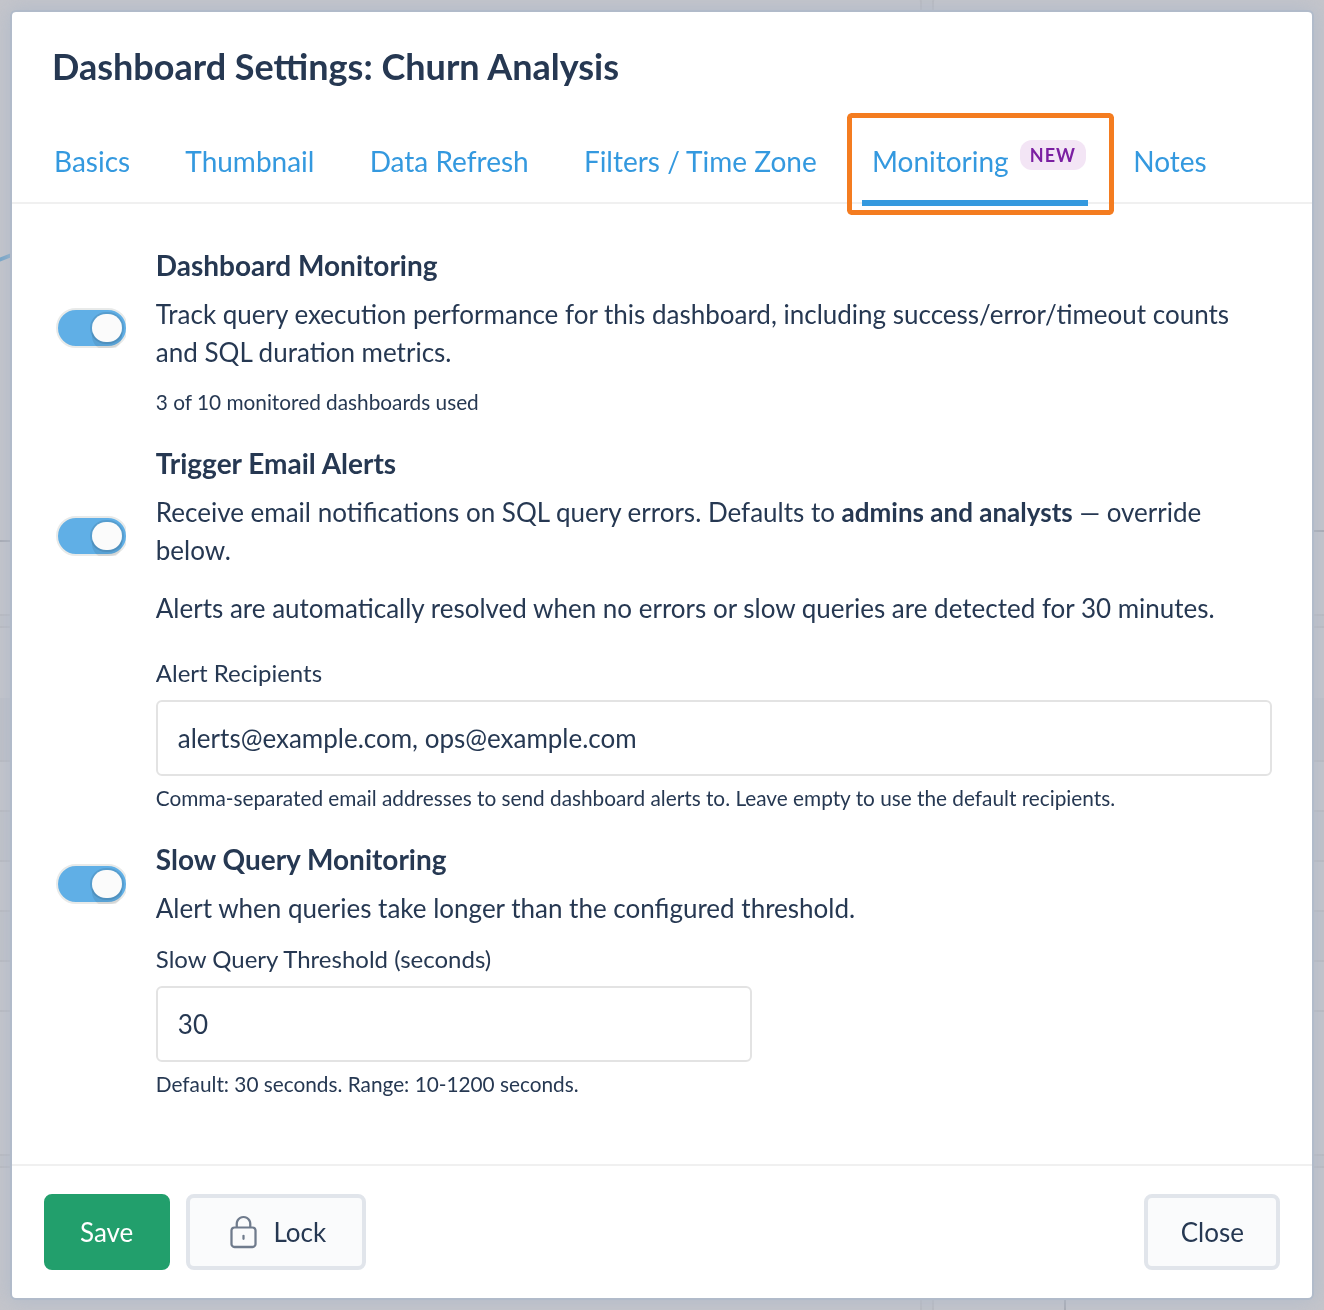
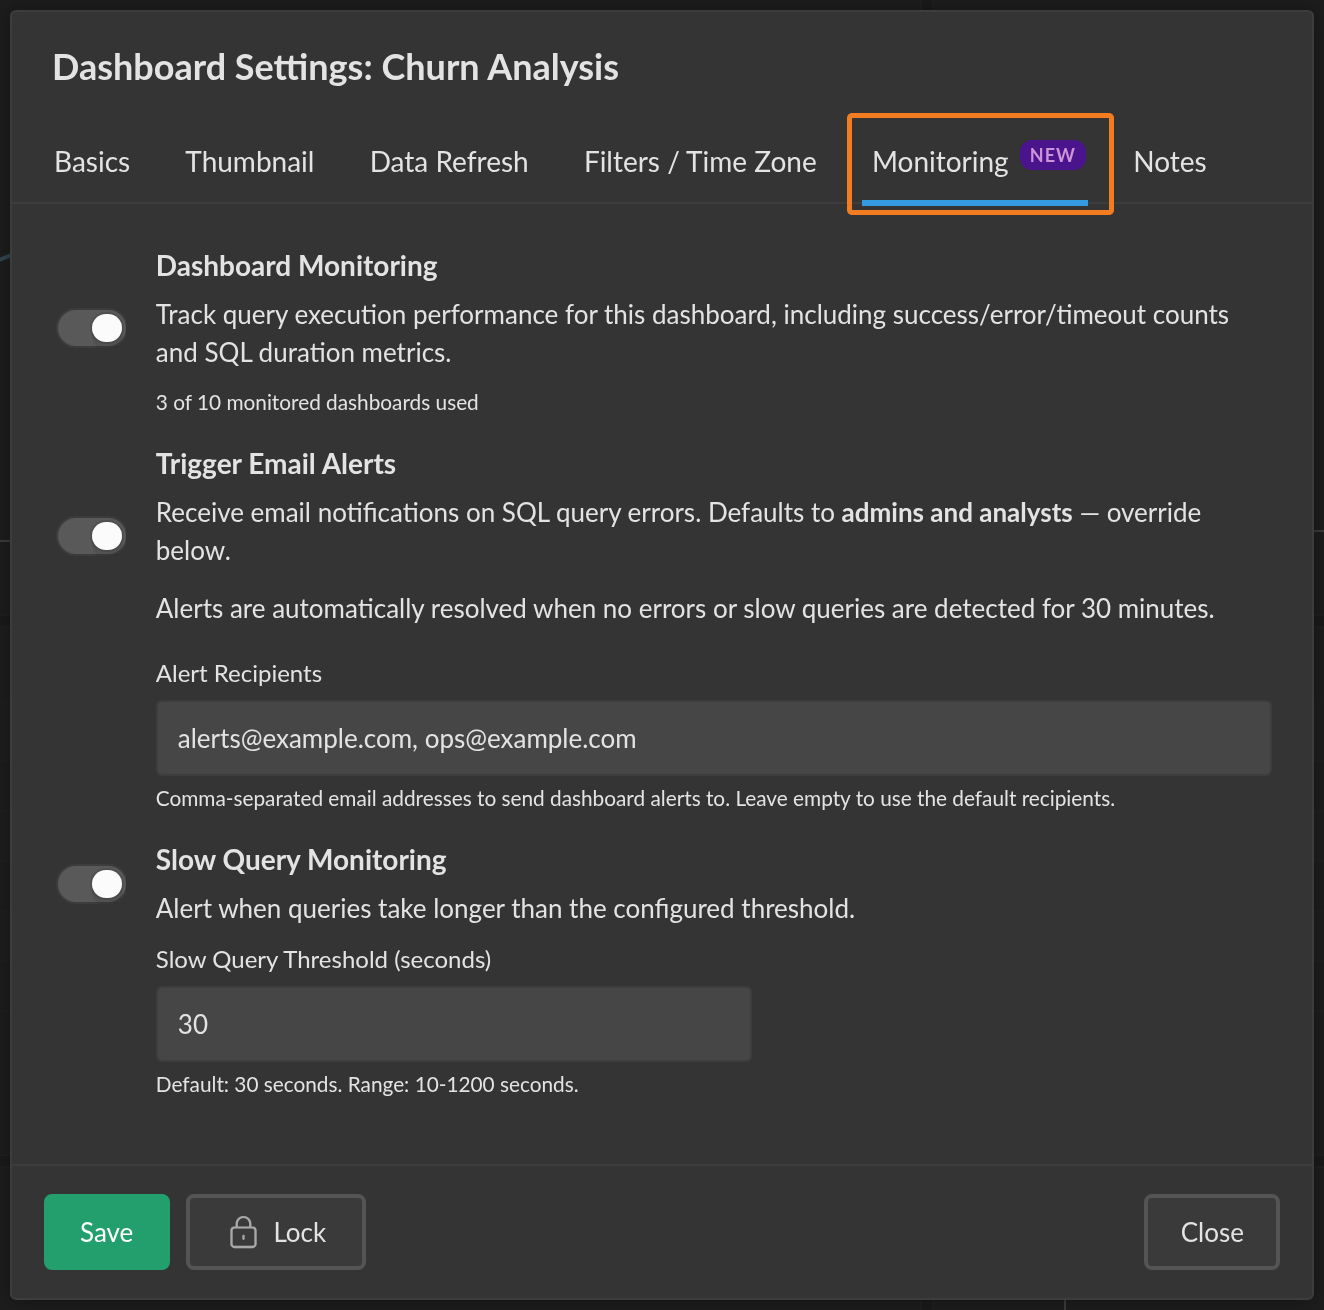
This alone starts tracking the dashboard's query performance — you'll see it on the Performance & Insights tab (step 5).
3. Turn on e-mail alerts and choose recipients
With monitoring on, enable Trigger Email Alerts. By default, alerts go to:
- Admins and analysts, for a published dashboard, or
- the dashboard owner, for a draft.
To override, enter a comma-separated list in Alert Recipients. These can be anyone — they don't need a Cluvio account.
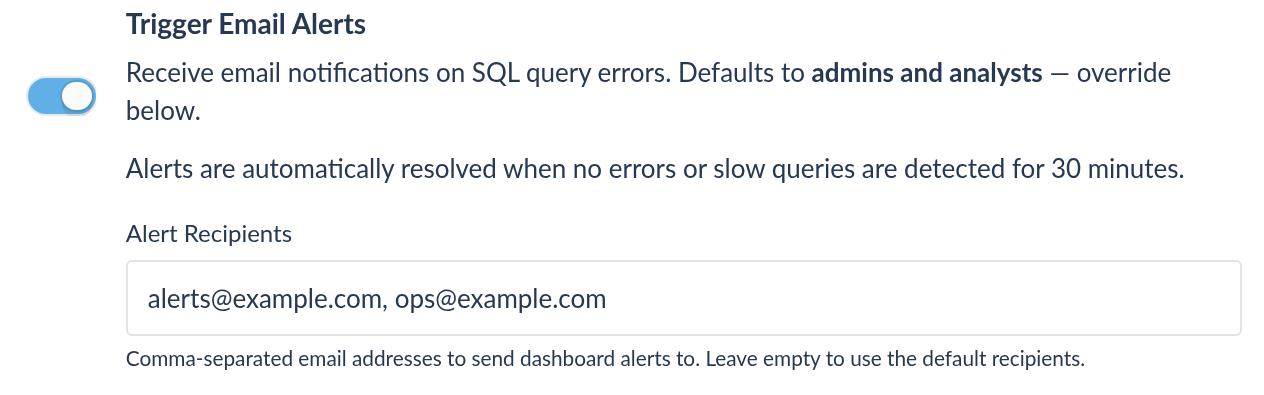
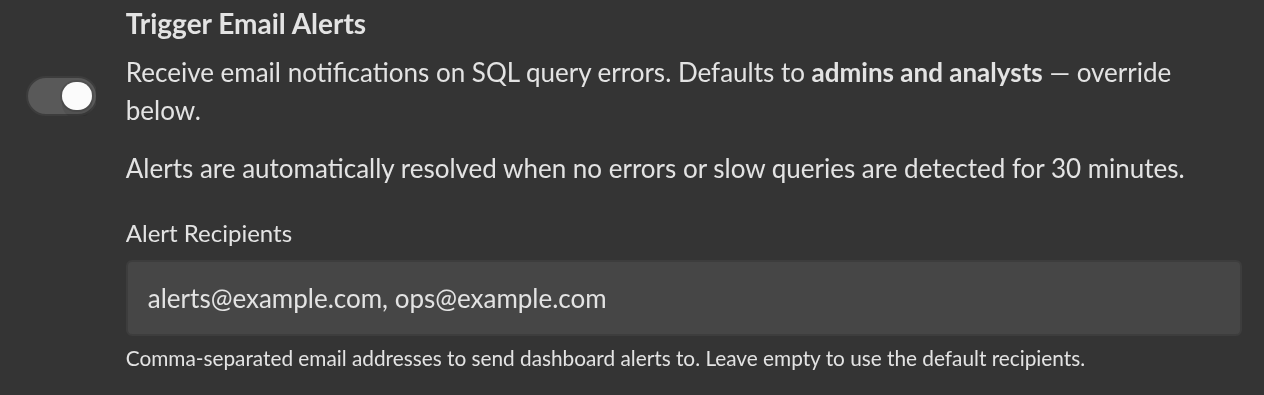
An alert automatically resolves after 30 minutes with successful queries and no errors / no slow queries. You don't have to clear it manually.
4. Alert on slow queries too
By default, alerts fire on query errors. To also be warned when queries get slow, turn on Slow Query Monitoring and set the Slow Query Threshold — the number of seconds a query may run before it counts as slow (default 30s, range 10–1200s).
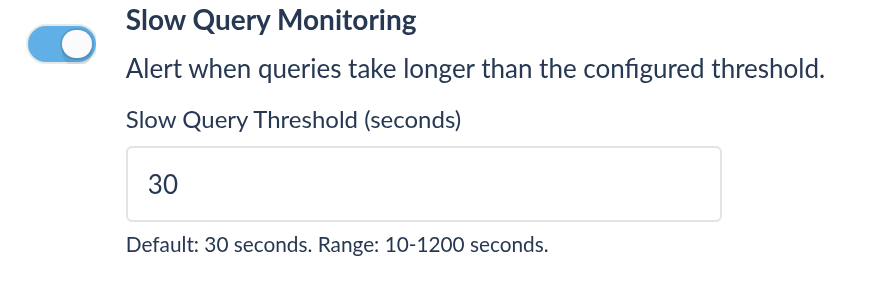
Pick a threshold a little above your dashboard's normal worst-case load time, so you're alerted to genuine regressions rather than ordinary heavy queries.
5. Know what happens when an alert fires
When a monitored dashboard starts failing, three things happen:
- The nominated recipients get an e-mail.
- The dashboard's tab strip shows an Alert (Active) badge.
- The Alert tab fills in with the active alert.
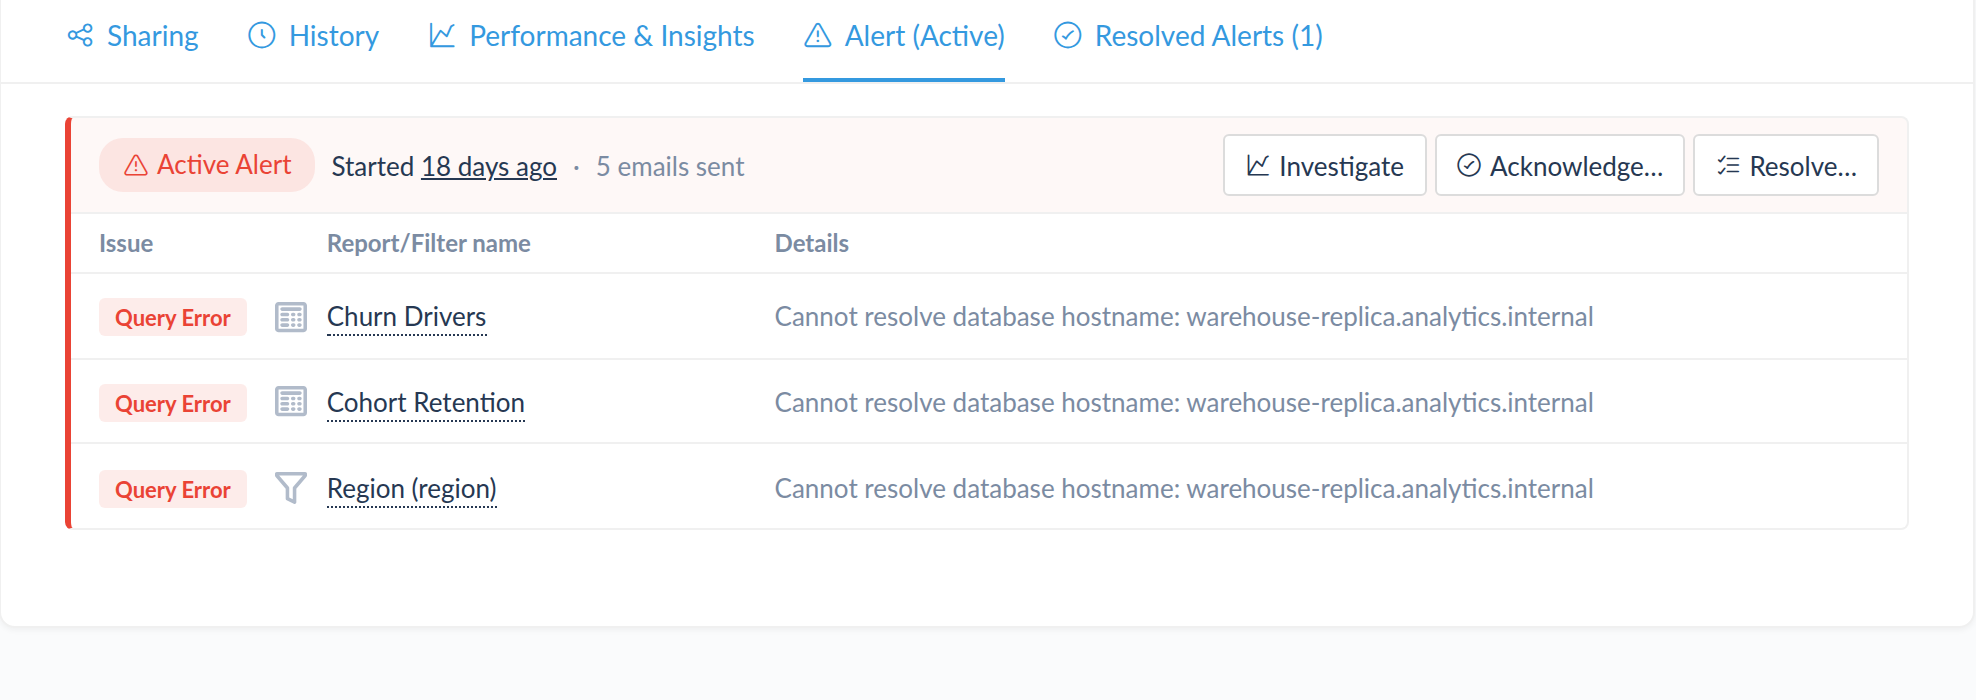
On the Alert tab you can:
- See when the alert started and how many e-mails have been sent.
- Review the affected objects (which reports / queries are failing or slow).
- Acknowledge the alert to signal to your team that someone is on it (the badge turns amber instead of red).
Once every affected object recovers, a green auto-resolve countdown appears — "All problems fixed, the alert will auto-resolve in N minutes…". If no new errors arrive, the alert clears itself and moves to Resolved Alerts.
6. Use Performance & Insights to dig in
The Performance & Insights tab is where you investigate. It shows the dashboard's access activity and query-completion trends, draws the slow-query threshold line on the chart, and gives you Slow Queries and Query Errors sub-tabs scoped to this dashboard.
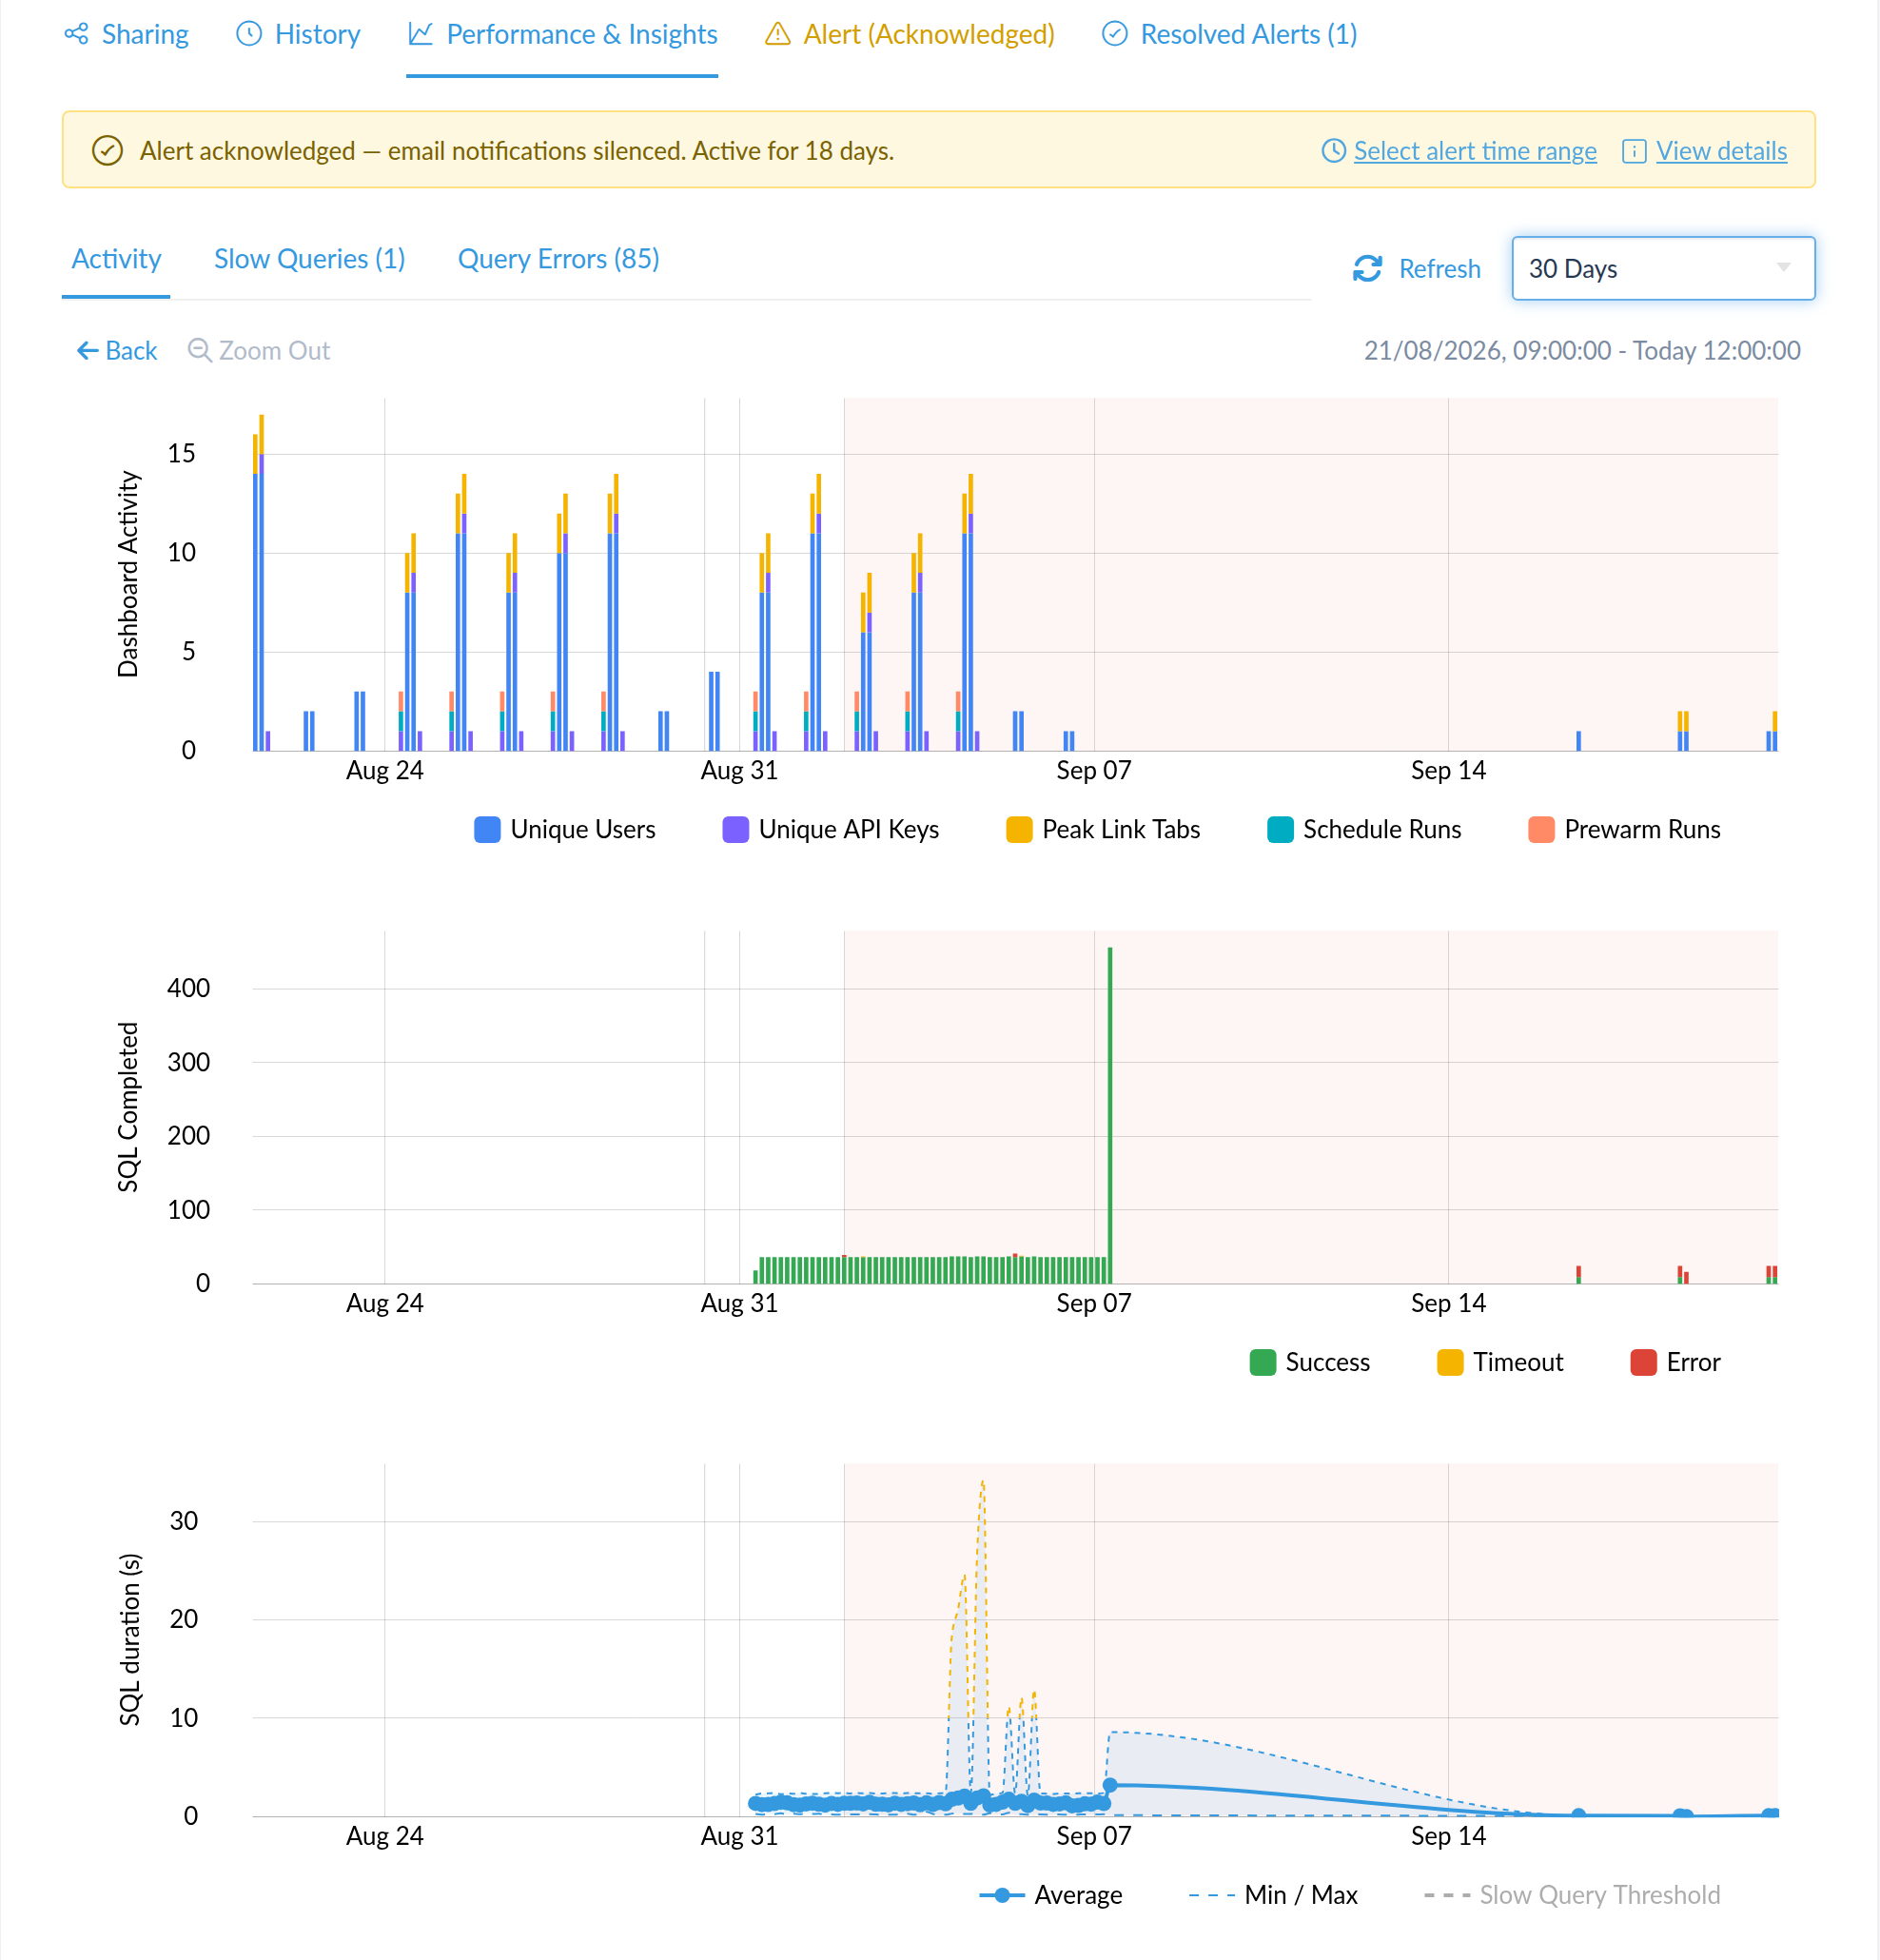
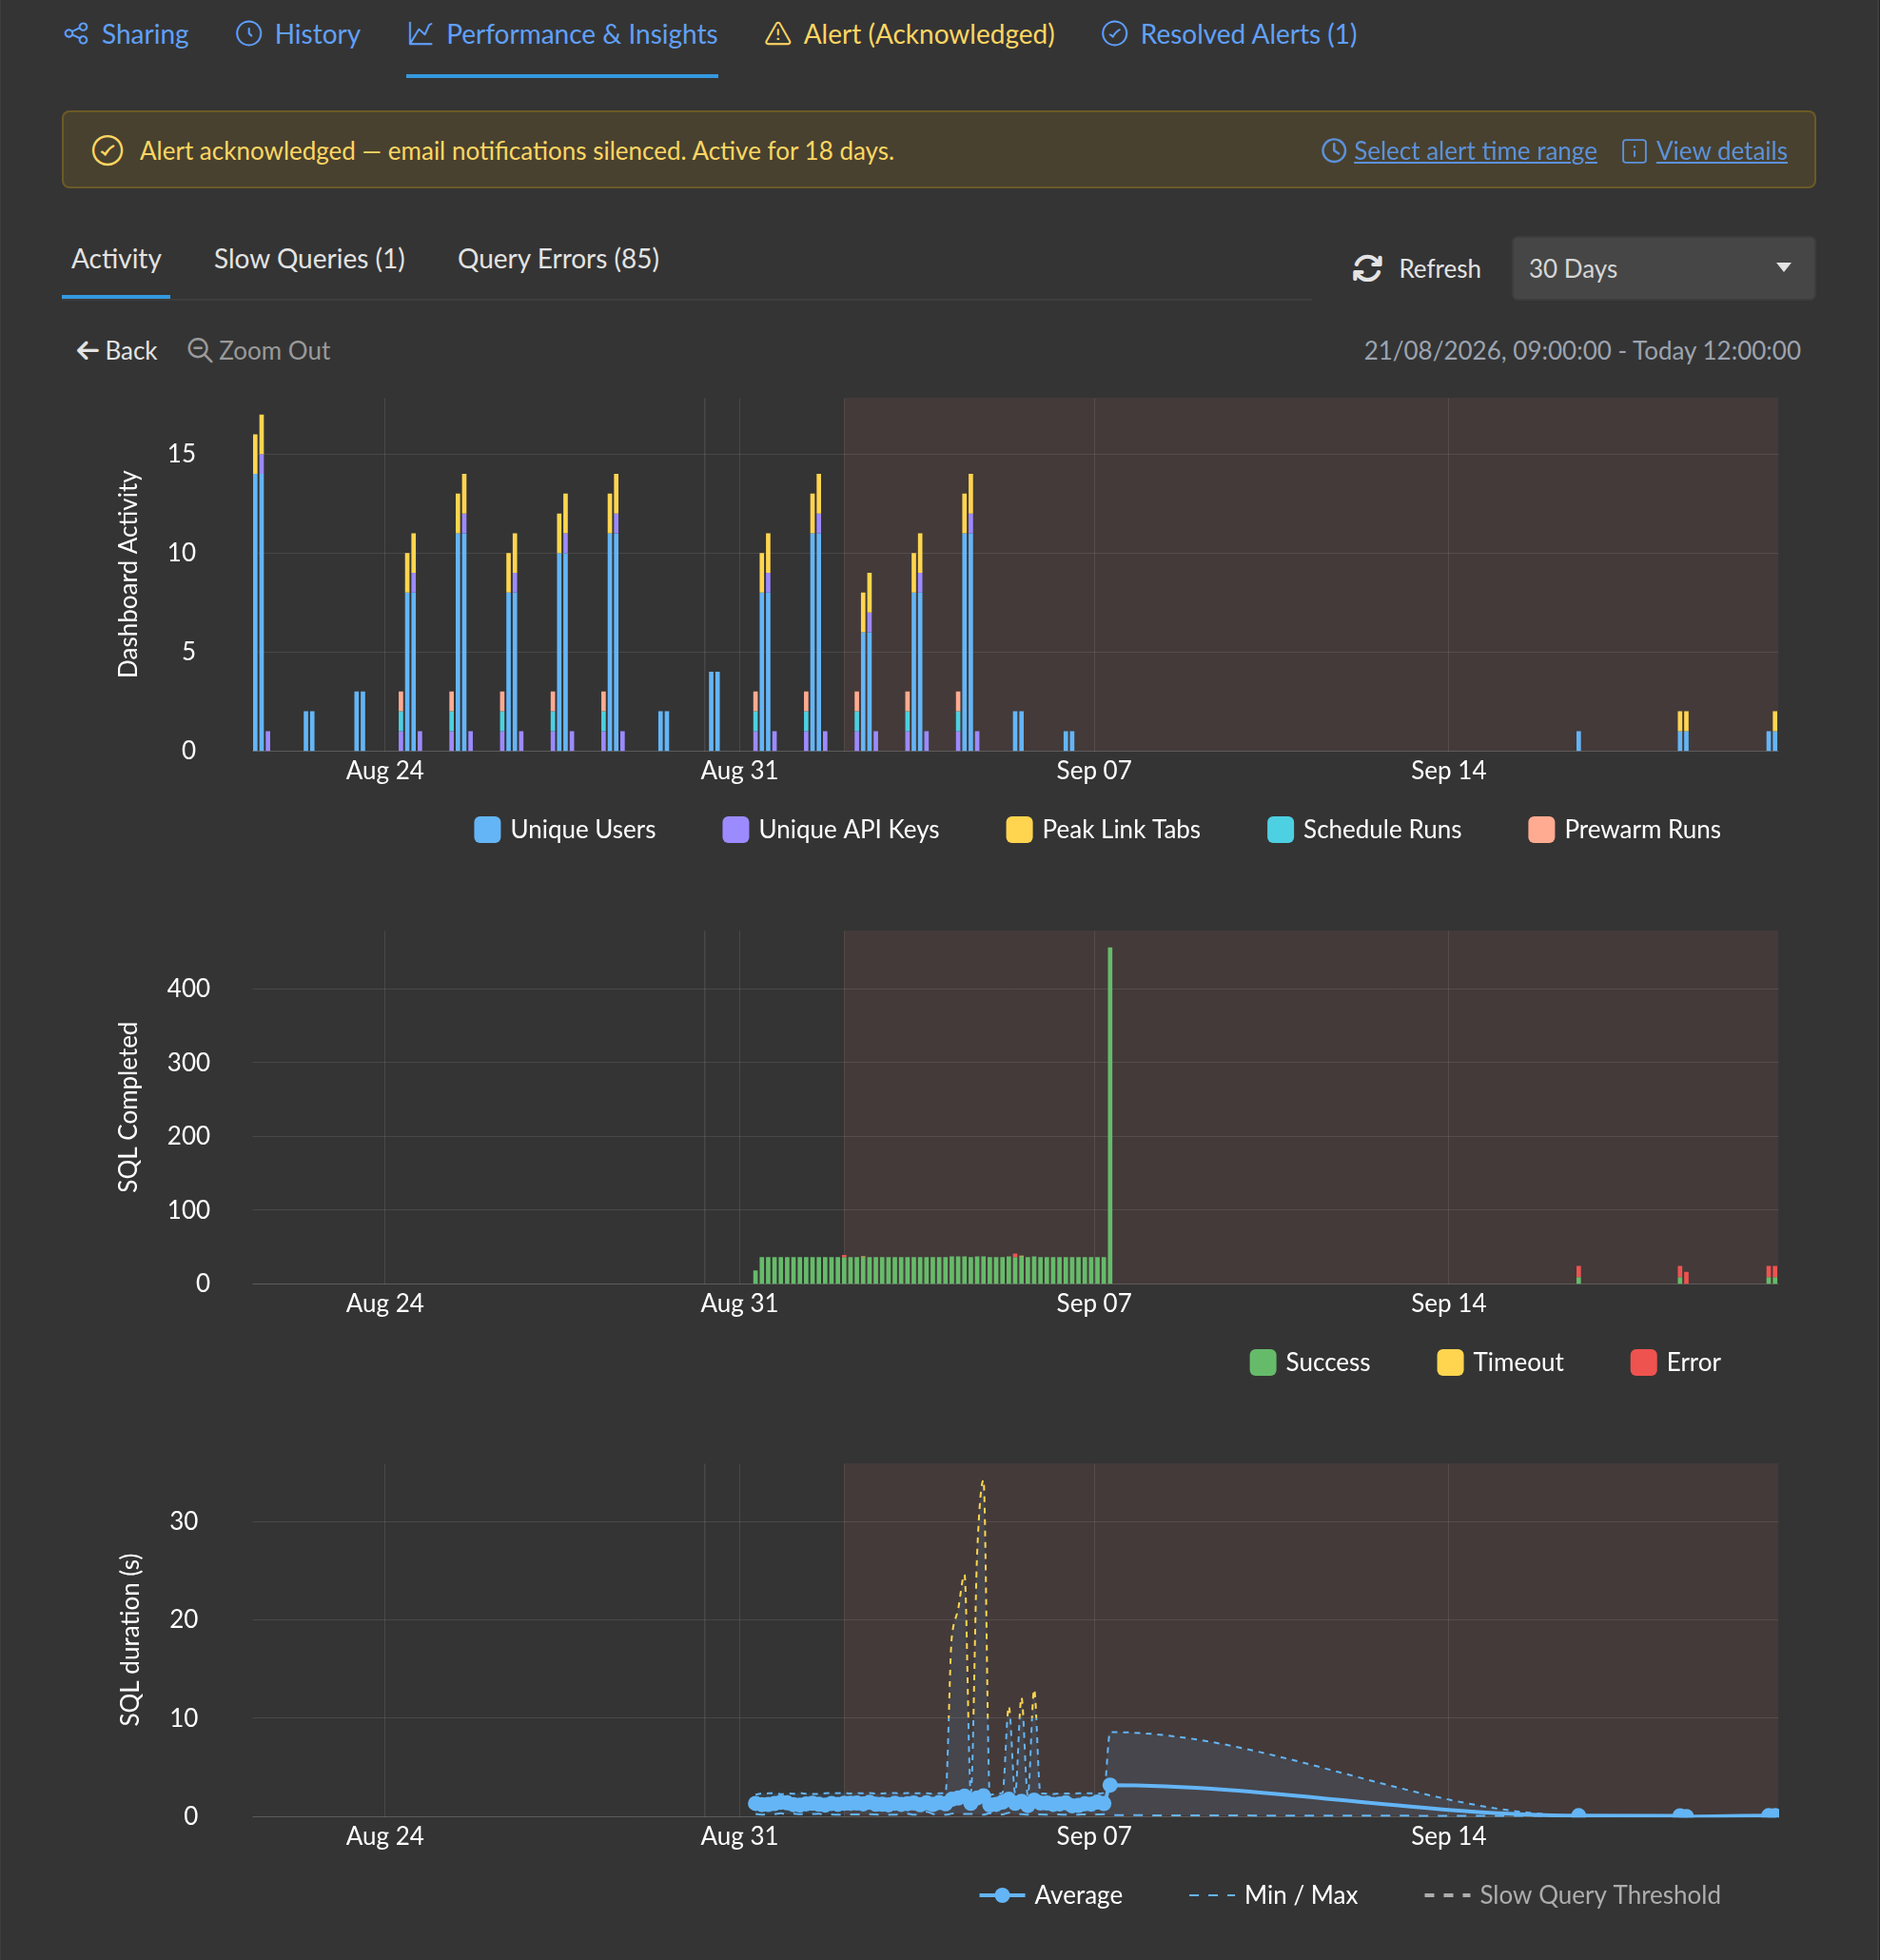
When you need to drill all the way into a specific slow query, the mechanics are the same as for a datasource — see Investigate a slow query.
Related
- How-To: Investigate a slow query — what to do once monitoring points you at one.
- How-To: Investigate query errors — what to do when the alert is about failures rather than slowness.
- Reference: Performance & Insights — the metrics and charts in detail.
- Reference: SQL Alerts — for alerting on the data itself (a metric crossing a threshold) rather than on query health.