SQL Alerts
Not available on the Free plan (see Plans Comparison)
SQL Alerts are a powerful way to be notified proactively about changes in your data. Write a SQL query, set a schedule, and specify a condition on the results — Cluvio evaluates the query on the schedule and sends an e-mail whenever the condition is met.

SQL alerts can serve a variety of use-cases, for example:
- Get notified when error rates spike or when unexpected errors occur.
- Get notified when customers perform important actions, like adopting a new feature.
- Receive a brief morning digest of key metrics directly in your inbox.
- Monitor data quality and detect missing or anomalous records.
Managing Alerts
Manage all your SQL alerts from the SQL Alerts overview page.


The overview list shows every alert with the following columns:
- Name — the alert name and optional description.
- Activity — an inline chart showing recent alert results (see Activity Chart).
- Schedule — how often the alert runs.
- Last Run — relative time since the alert query last executed.
- Status — the current status indicator (see below).
All columns except Activity are sortable by clicking the column header. When you have many alerts, the list is paginated — use the page controls in the toolbar to move between pages.
Status Indicators
| Status | Meaning |
|---|---|
| Green | Alert query ran successfully and the trigger condition was not met. |
| Orange | Alert query ran and the trigger condition was met. |
| Red | Alert query ran but produced an error (query error, configuration error, or unexpected results). |
| Grey | Alert has never been run, or is disabled. |
Activity Chart
The Activity column displays a stacked bar chart of recent alert results, giving you an at-a-glance view of alert health over time. Each bar represents a time bucket and is color-coded: green for OK, orange for triggered, and red for errors.
Use the 24h / 30d toggle in the column header to switch between the last 24 hours and the last 30 days. Click on a chart to open the full Results History.
The Activity column can be hidden using the Hide link in the column header. When hidden, a Show Activity link appears in the toolbar to restore it.
Actions Menu
From the actions menu on any alert you can:
- Edit — open the alert configuration dialog.
- Duplicate — create a copy of the alert with all settings pre-filled, ready to be customized and saved under a new name.
- Run Alert — trigger the alert query immediately, regardless of the schedule. The result is evaluated against the trigger condition and e-mails are sent if the condition is met.
- Results History — open the alert results history (see Results History).
- Delete — permanently remove the alert.
Creating and Editing an Alert
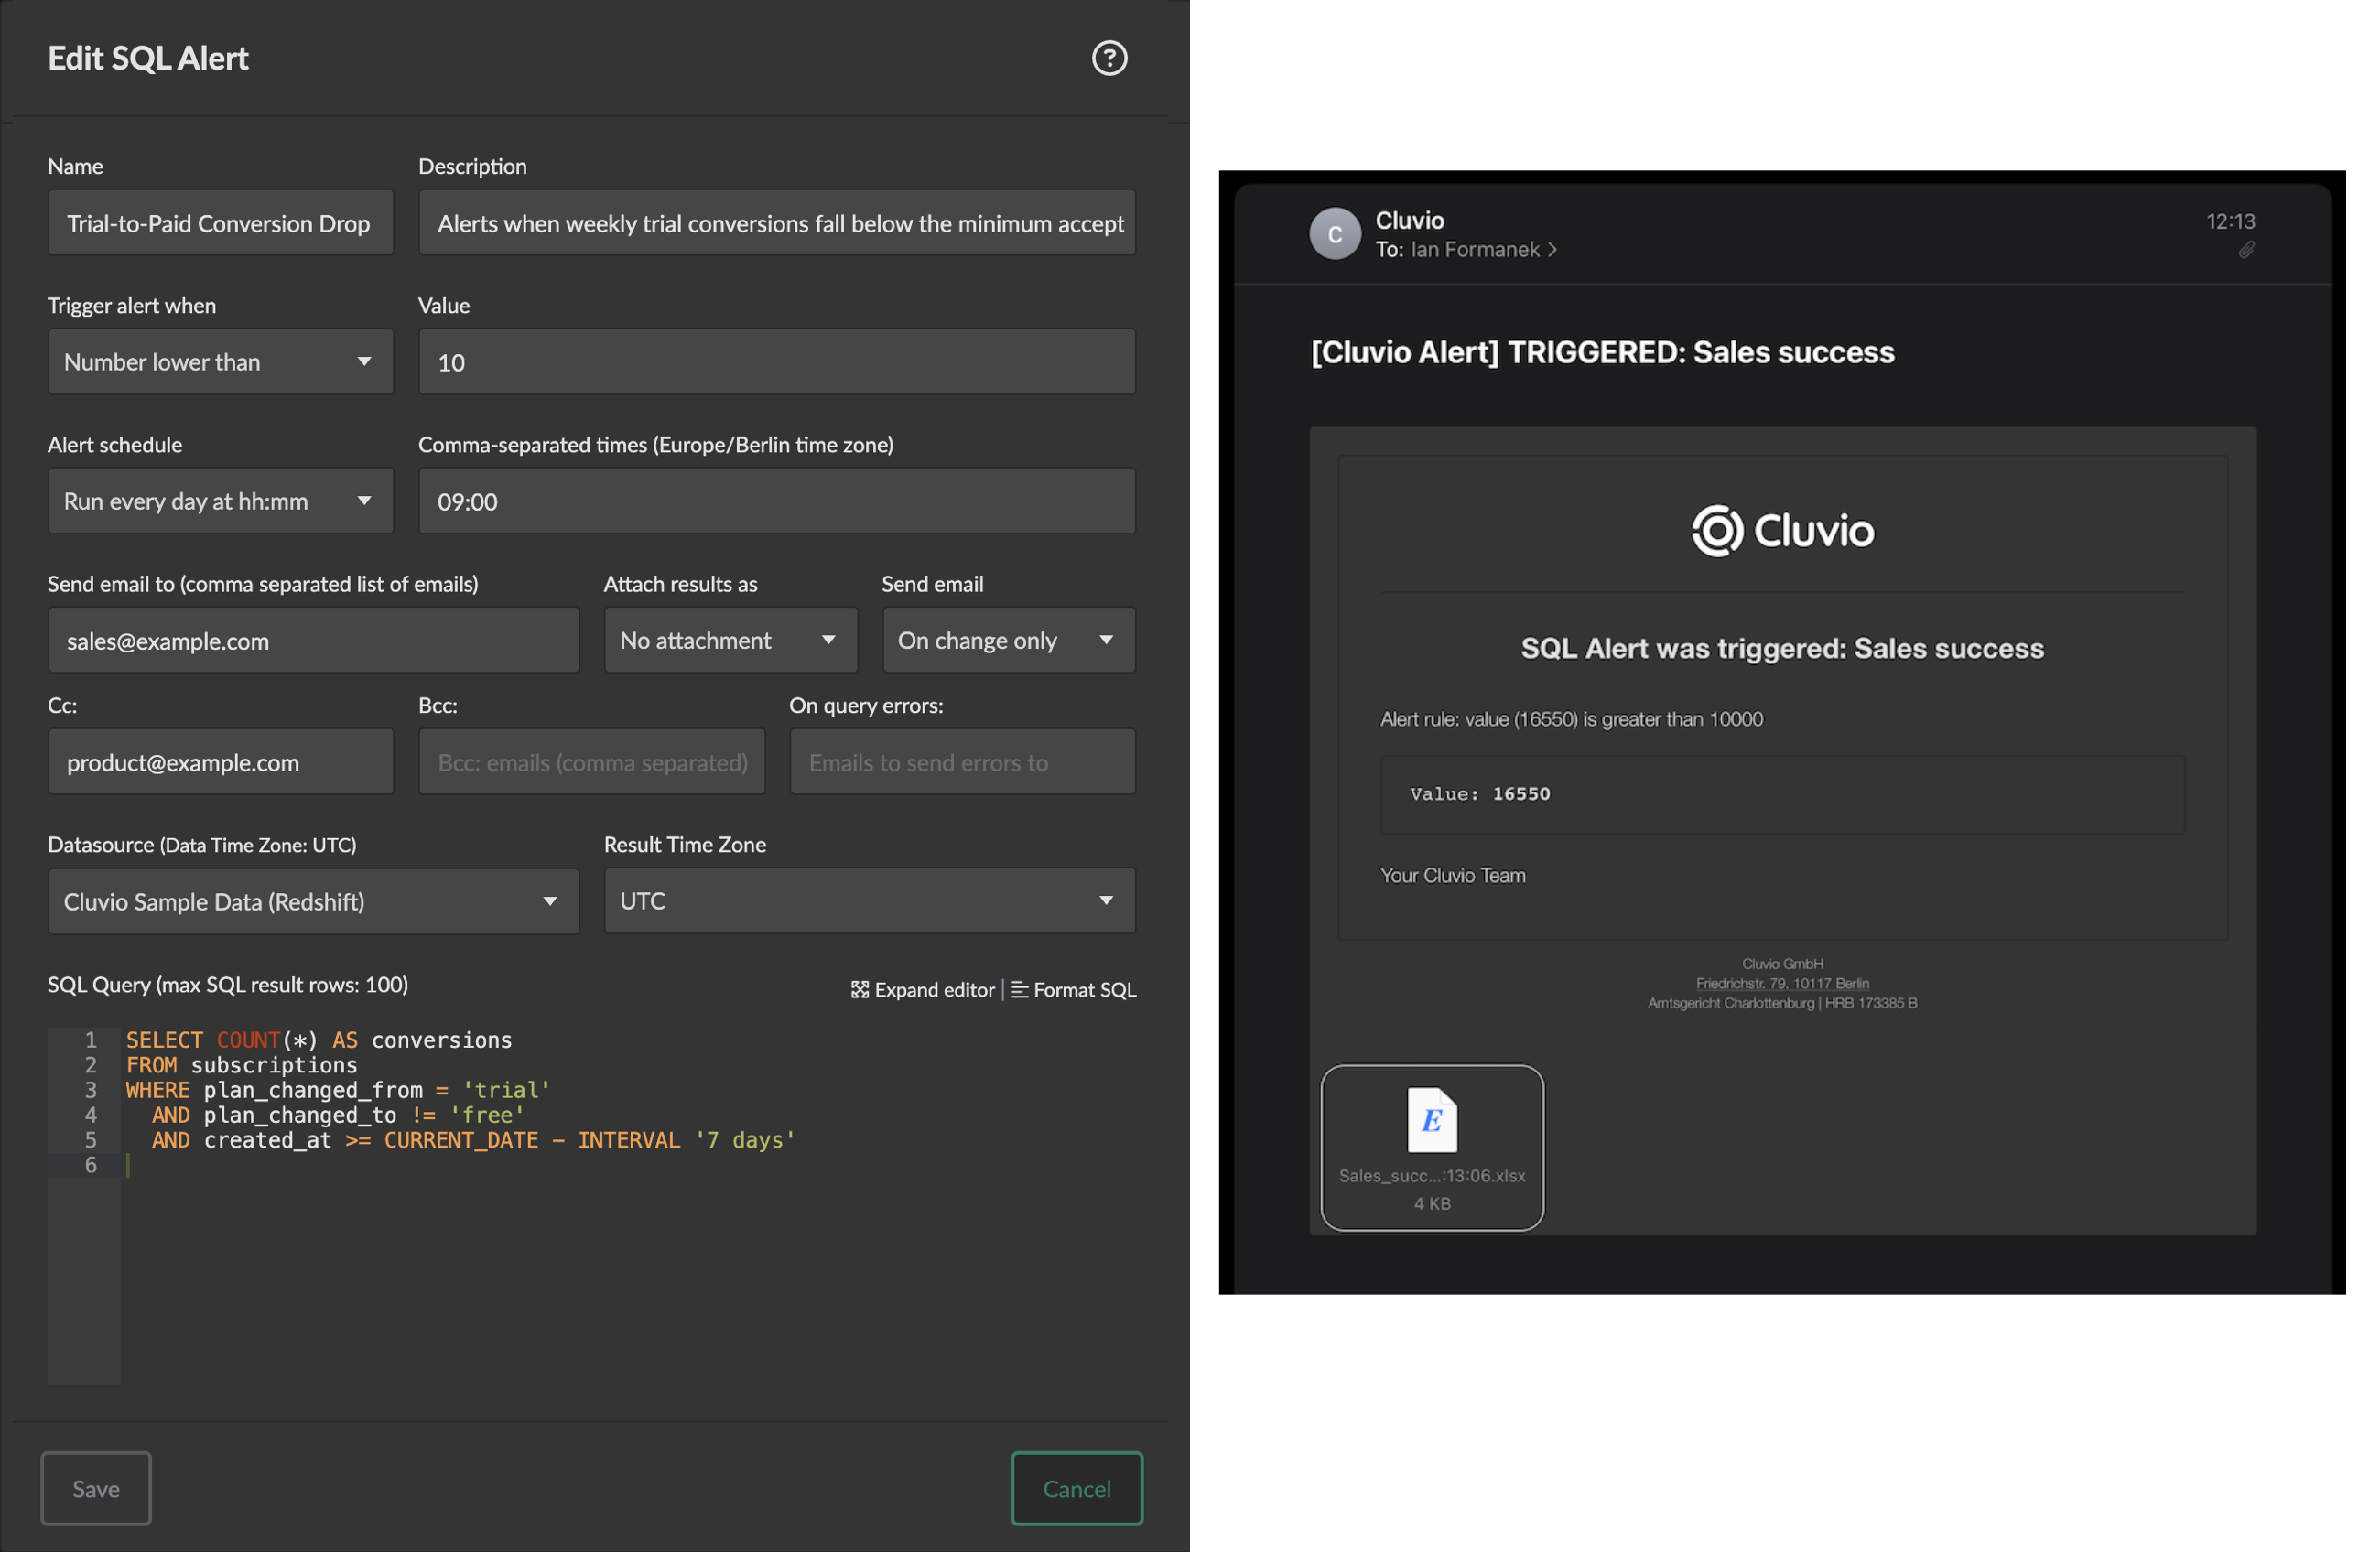
Select Add SQL Alert to create a new alert, or choose Edit from an existing alert's actions menu.
Name and Description
The Name identifies the alert in the overview list and in notification e-mails. The optional Description provides additional context for team members reviewing the alert configuration.
Datasource and SQL Query
The Datasource specifies which database connection to use when running the alert query.
The SQL Query is the query whose results are evaluated against the trigger condition. You can use SQL Snippets and Filters in the query, just as you would in a report.
Alert queries have a result row limit of 100 rows. If you need a higher limit,
please contact support@cluvio.com. Note that there are also practical limits
on the number of rows that can be included in an e-mail attachment.
Trigger Condition
The Trigger condition controls when the alert fires:
- Query produces some rows — triggers when the query returns at least one row. Useful for detecting the appearance of records that should not exist, or events that require attention.
- Query produces no rows — triggers when the query returns no rows. Useful for detecting the absence of expected data (e.g. a daily load that did not arrive).
- Value greater / lower / equal / not-equal — triggers when a single numeric value in the query result satisfies the comparison. The query must return exactly one row and one numeric column. The alert also fires if the query returns unexpected results (no rows, multiple rows, or multiple columns).
Alert Schedule
The Alert schedule determines when and how often the alert query runs:
- Disabled — the alert is not run automatically. It can still be triggered manually using Run Alert from the actions menu.
- Run every x minutes/hours — the query runs repeatedly at the specified interval. Each run is scheduled relative to the previous one; for example, a 24-hour interval schedules the next run 24 hours after each execution.
- Run every day at HH:MM — the query runs at one or more specific times of day.
Separate multiple times with a comma, e.g.
08:00, 12:00, 18:00. Times are interpreted in the organization time zone.
Alerts can be delivered to Slack channels via the Slack Email App. See Scheduled E-Mails → Slack Integration for setup instructions — the same approach works for SQL alerts.
Recipients
Send email to accepts a comma-separated list of e-mail addresses that will receive the alert notification.
The optional CC and BCC fields work the same way and accept comma-separated lists of addresses to copy or blind-copy on the alert e-mail.
If no e-mail addresses are configured, the alert query still runs on its schedule and the status indicator is updated, but no e-mails are sent even when the trigger condition is met.
When to Send
Send email controls how often notifications are delivered when the alert query is run:
- When triggered — an e-mail is sent every time the trigger condition is met.
- On change only — an e-mail is sent only when the outcome of the trigger condition changes, i.e. when it transitions from not-met to met, or from met to not-met. Use this to avoid receiving repeated notifications for a persistent condition.
- On all runs — an e-mail is sent on every run regardless of the trigger condition. The trigger condition only determines the subject line of the e-mail.
Attachments
The results of the alert query can be attached to the notification e-mail as a CSV or Excel file. Select the desired format from the Attach results as dropdown.
Notes
The Notes field accepts free-form text (supports Markdown) and is useful for documenting the alert's purpose, how to investigate when it fires, or links to runbooks. Notes are visible in the alert configuration dialog and serve as internal documentation for your team.
Results History
Select Results History from an alert's actions menu, or click the activity chart in the overview list, to open the run history for that alert.
The history page shows a chronological list of all past executions of the alert query, with the most recent run at the top. For each run you can see:
- Run time — when the alert query was executed.
- Result — whether the trigger condition was met (
Triggered), not met (OK), or whether the run produced an error. - Error message — for failed runs, the error message returned by the database or Cluvio's query engine.
The history is useful for auditing past alert behavior, investigating why an alert fired or did not fire at a particular time, and diagnosing recurring query errors.