Reports
Reports are the central components of a dashboard and visualize the results of SQL queries.
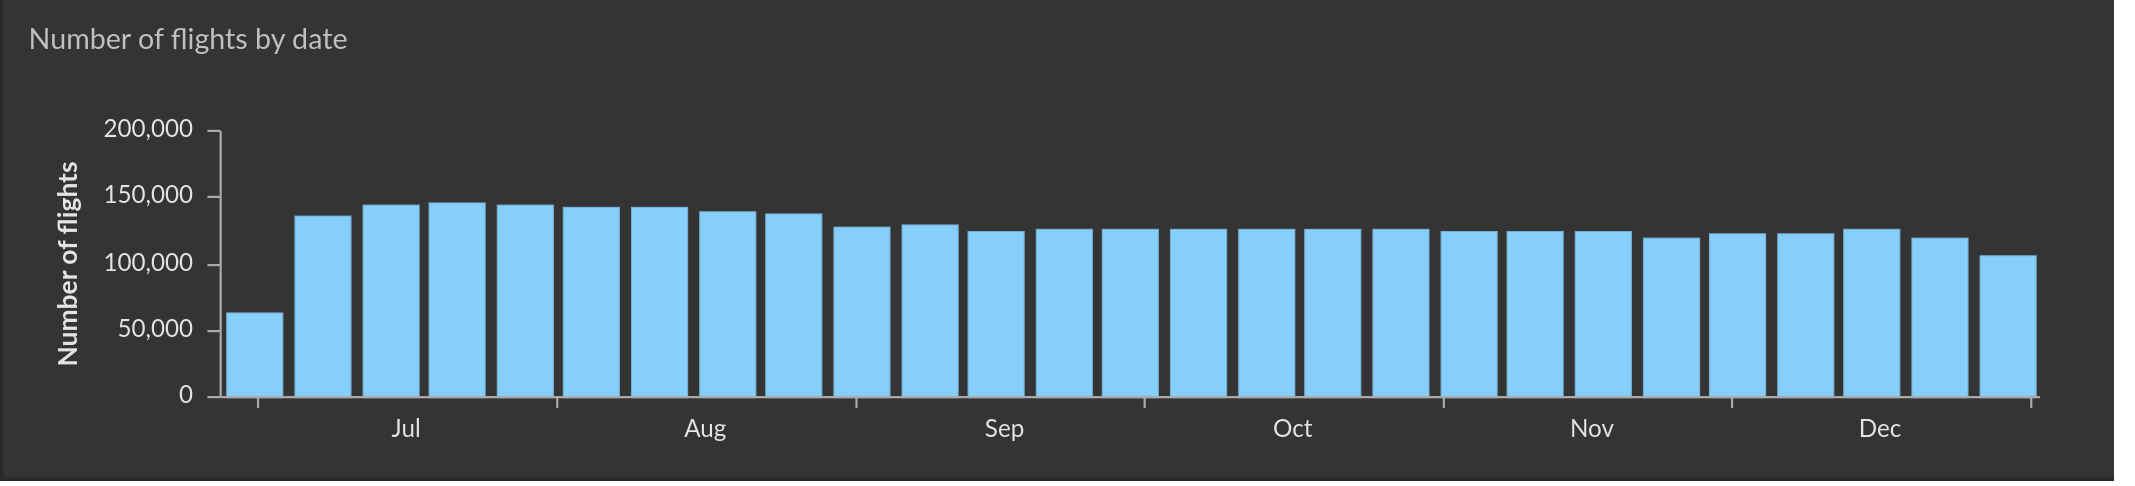
A report is defined by a SQL query, optionally an R query, and a chart configuration. The report editor is used to create reports by authoring the SQL and R queries that produce the results that capture the information of interest. A chart type is then chosen to create an engaging visualization of the information. Once created, the report settings allow fine-tuning of a report's appearance and the data refresh rate.
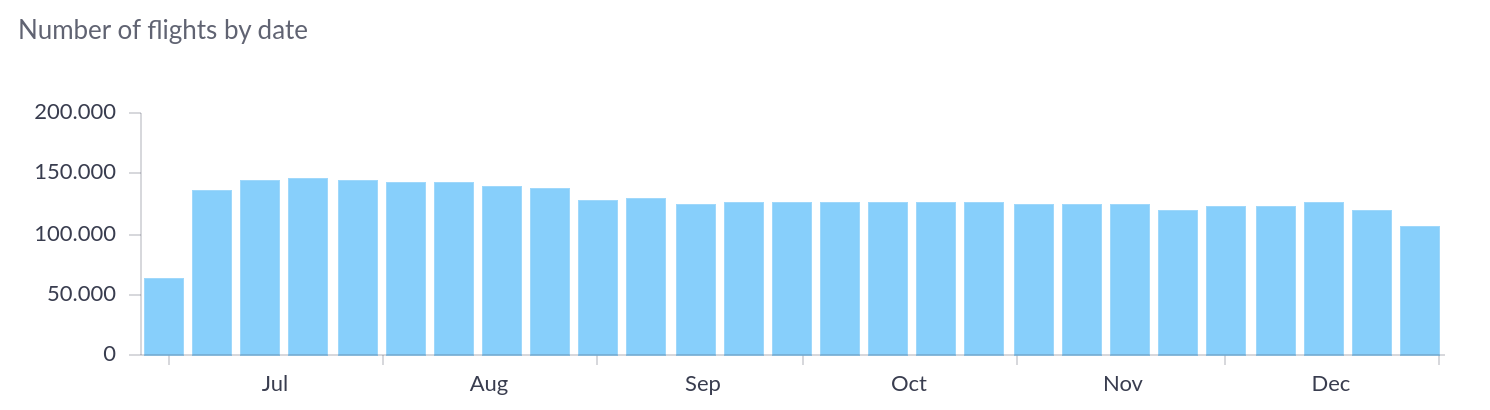
When viewing a report on a dashboard, the report actions allow not only to enter the report editor to make changes but also to force an immediate refresh or to download the report in various formats, incuding PDF, PNG and CSV, among other things. While only analysts (and admins) can author and edit reports in the report editor, the availability of most other actions depends on the authorization context and the selected plan.