Dashboards
A dashboard is a collection of reports laid out on an interactive grid. Dashboards are used to group together reports that give insight to a specific area of interest, such as sales, operations, support, etc. When you sign into your Cluvio account, you find yourself on the dashboards overview page, which shows the dashboards in your organization that are accessible to you as tiles with thumbnail images of each dashboard.
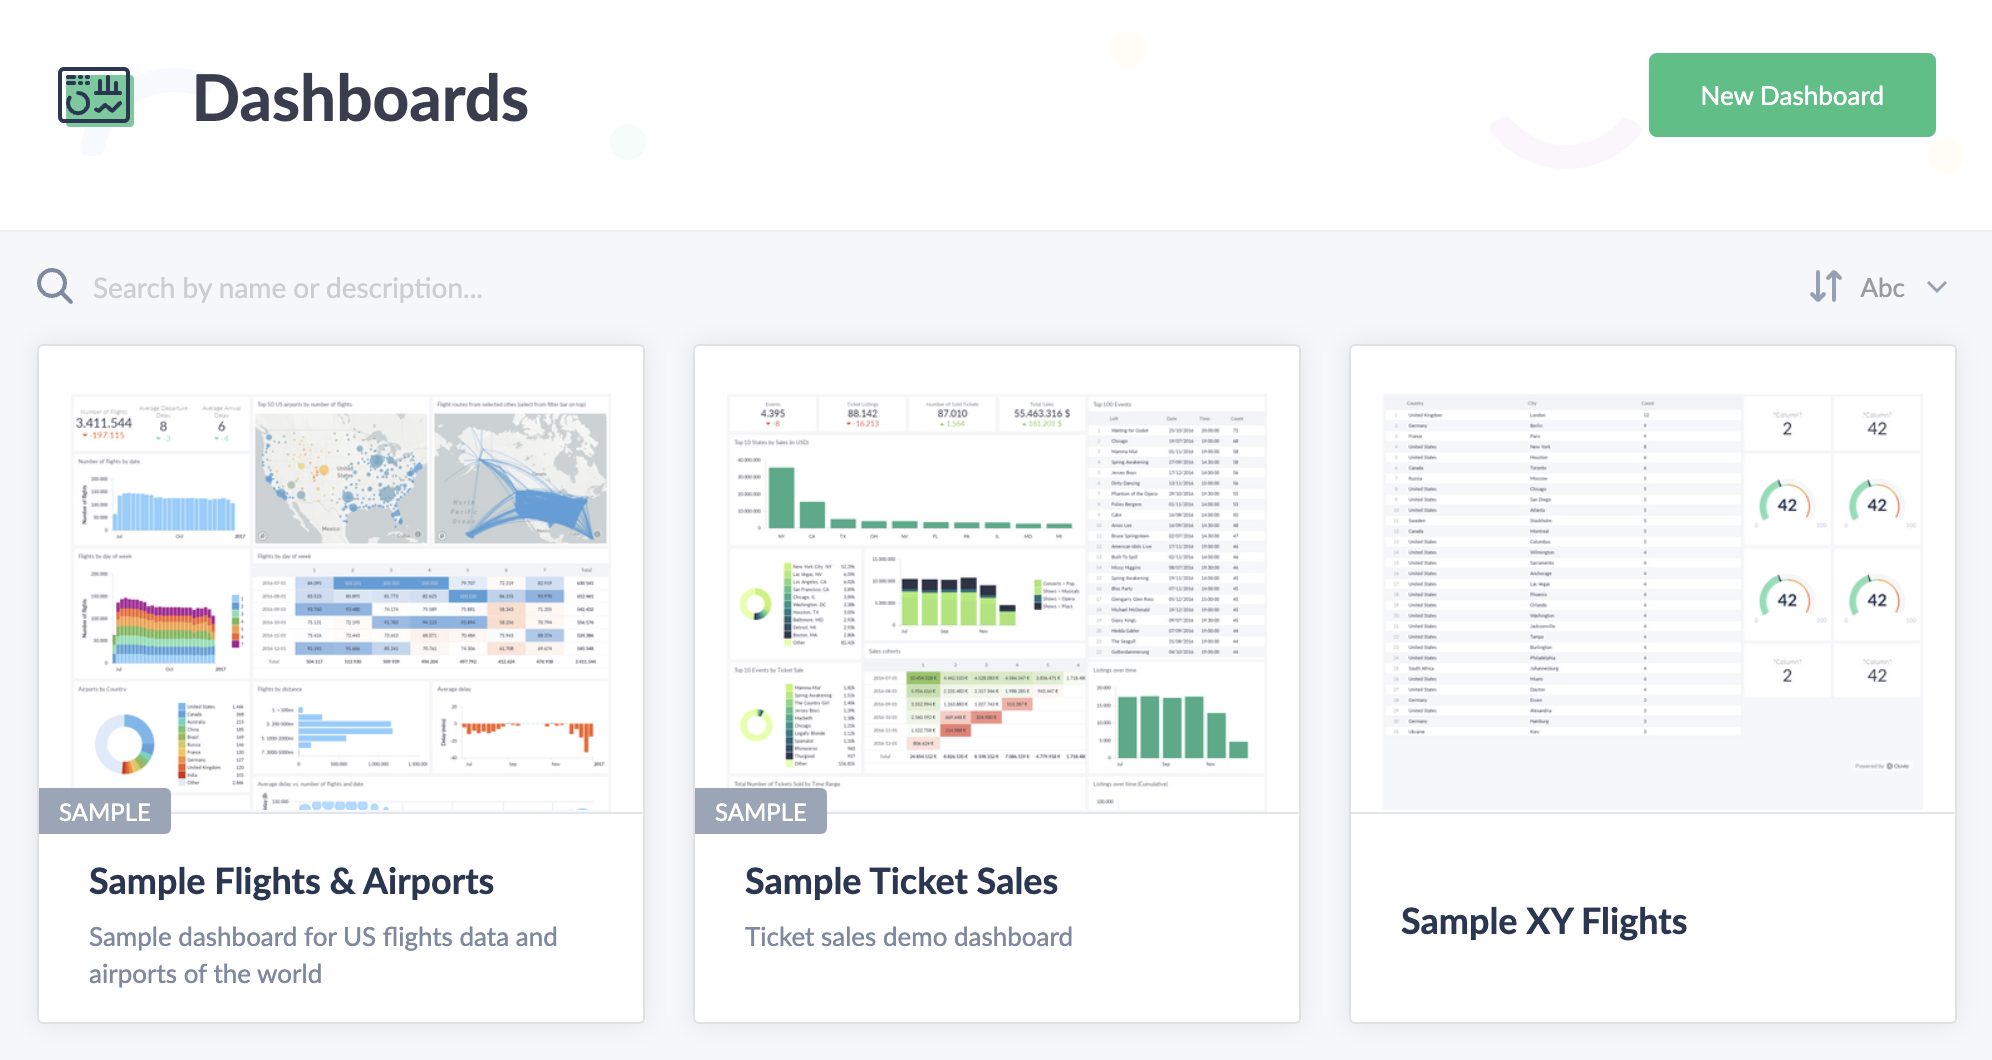
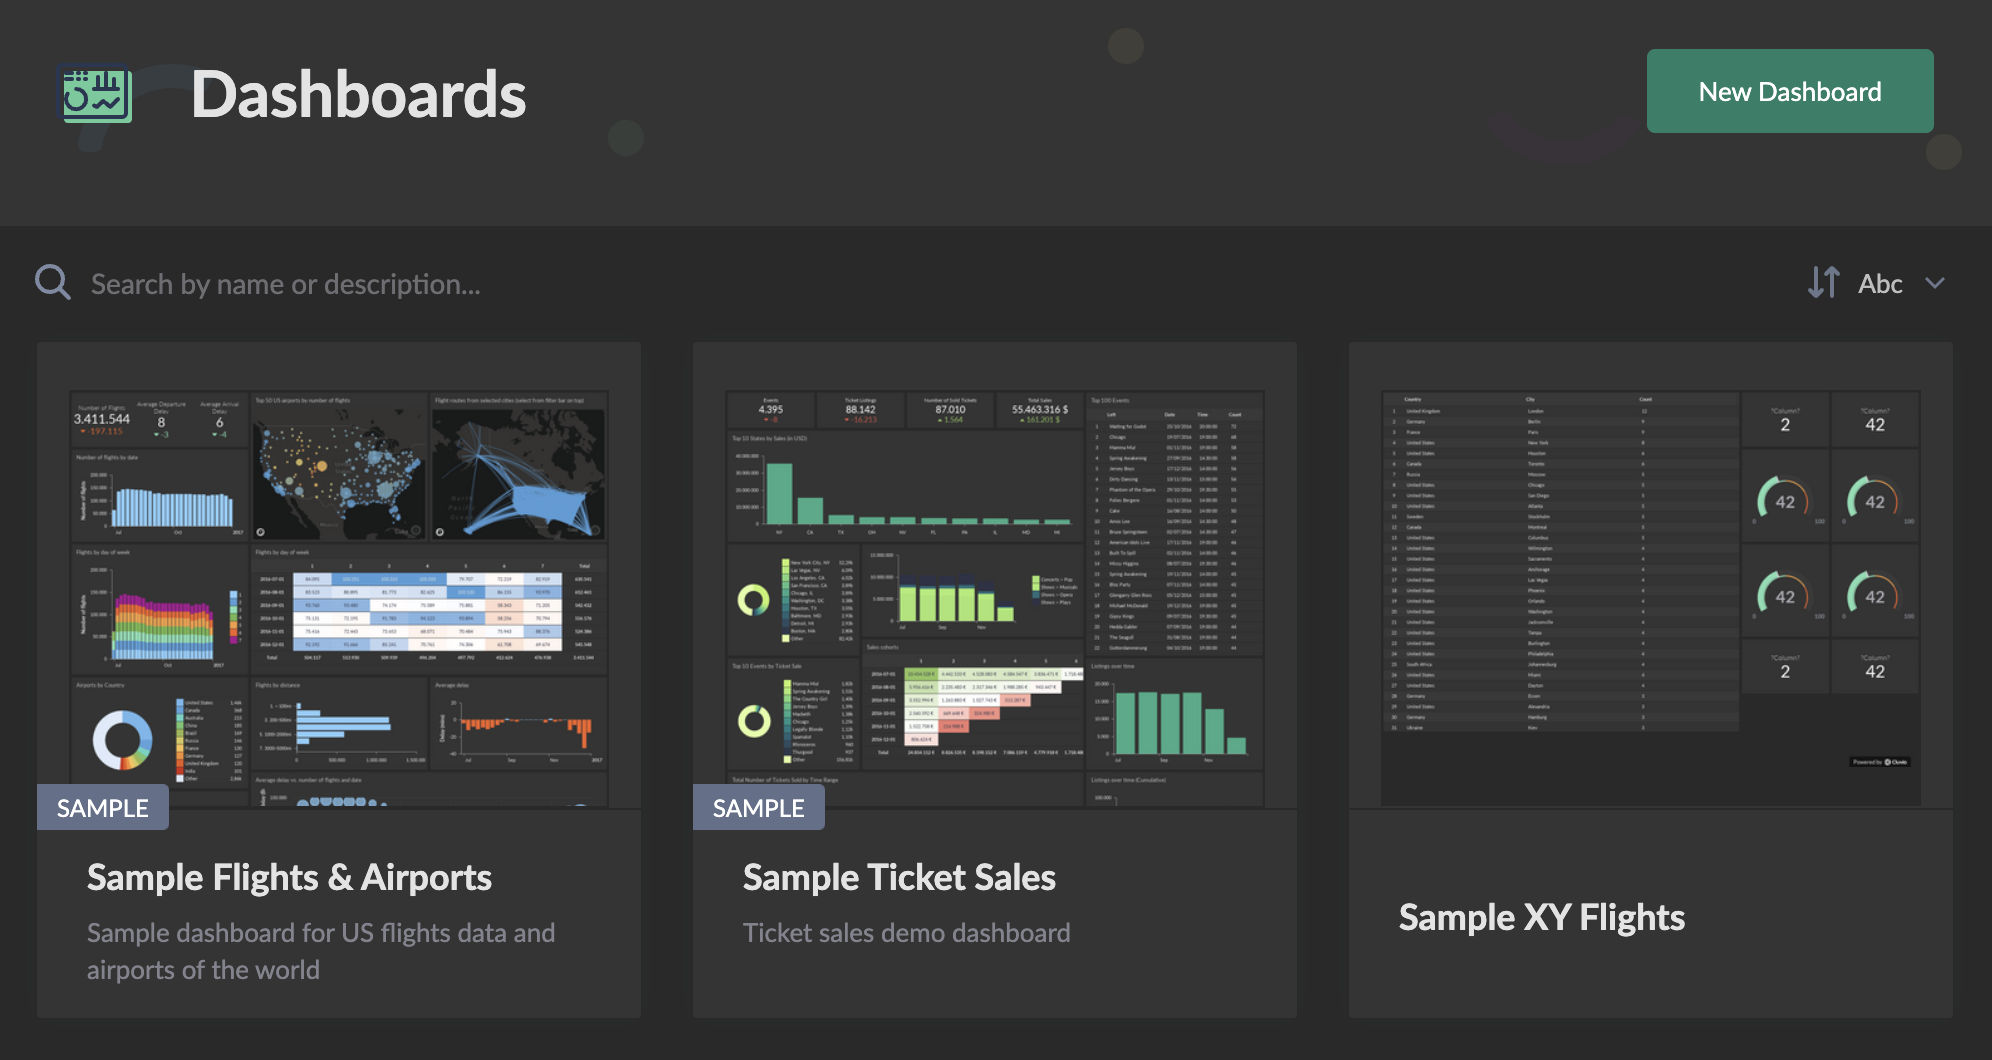
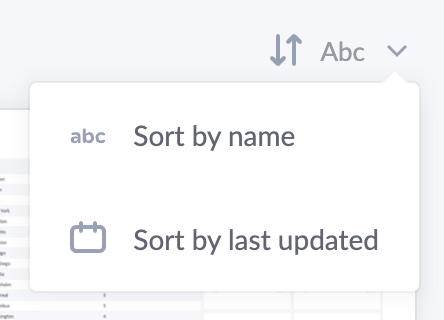
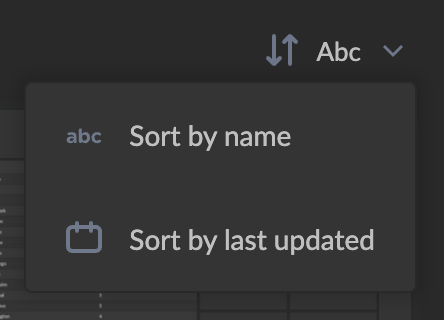
Dashboards can be organized using Dashboard Groups, as well as sorted by name or by the time they were last updated.
When clicking on the name or thumbnail of a dashboard, you are taken to the single dashboard view.
The data shown on a dashboard are automatically cached for up to 24 hours (or less) and automatically refreshed. If you put a dashboard on a TV on a wall (e.g. via sharing links), it will automatically update the content, rerunning the SQL queries according to the configured data refresh rates to always show the latest data.
In general, dashboards can be shared both inside and outside your organization or embedded in customer web apps or portals. Besides sharing, many other dashboard actions are available, such as rendering of PDFs, images, and more.
Interactivity
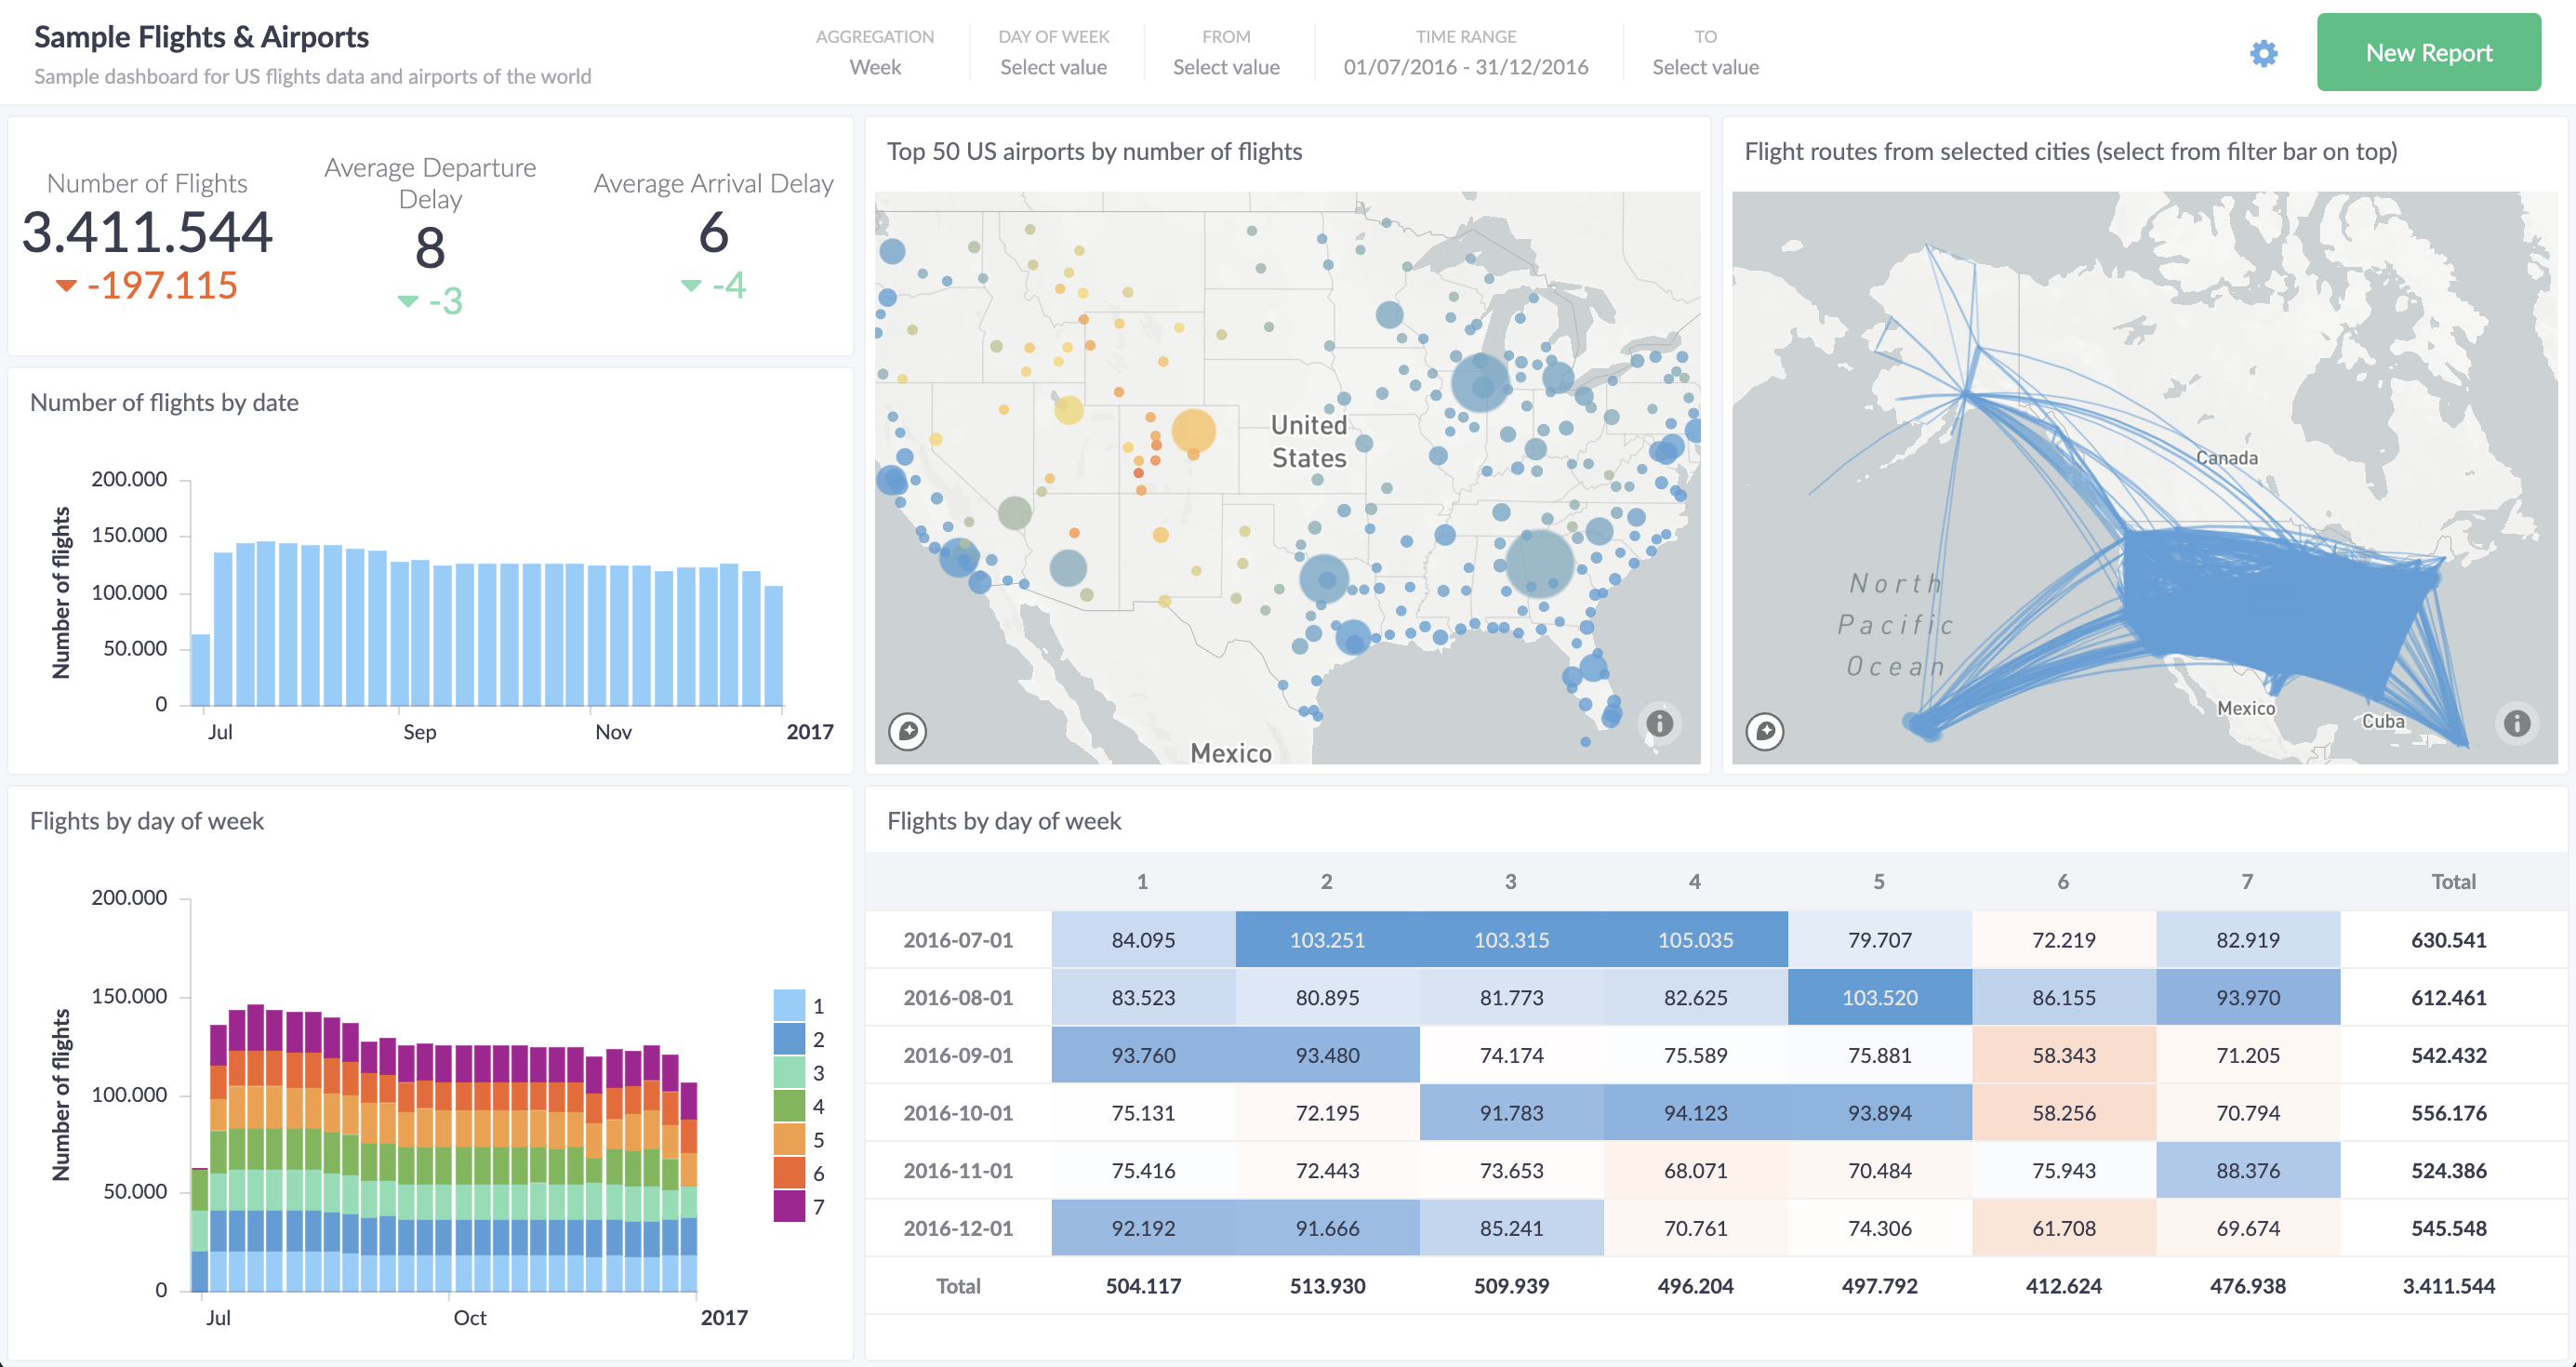
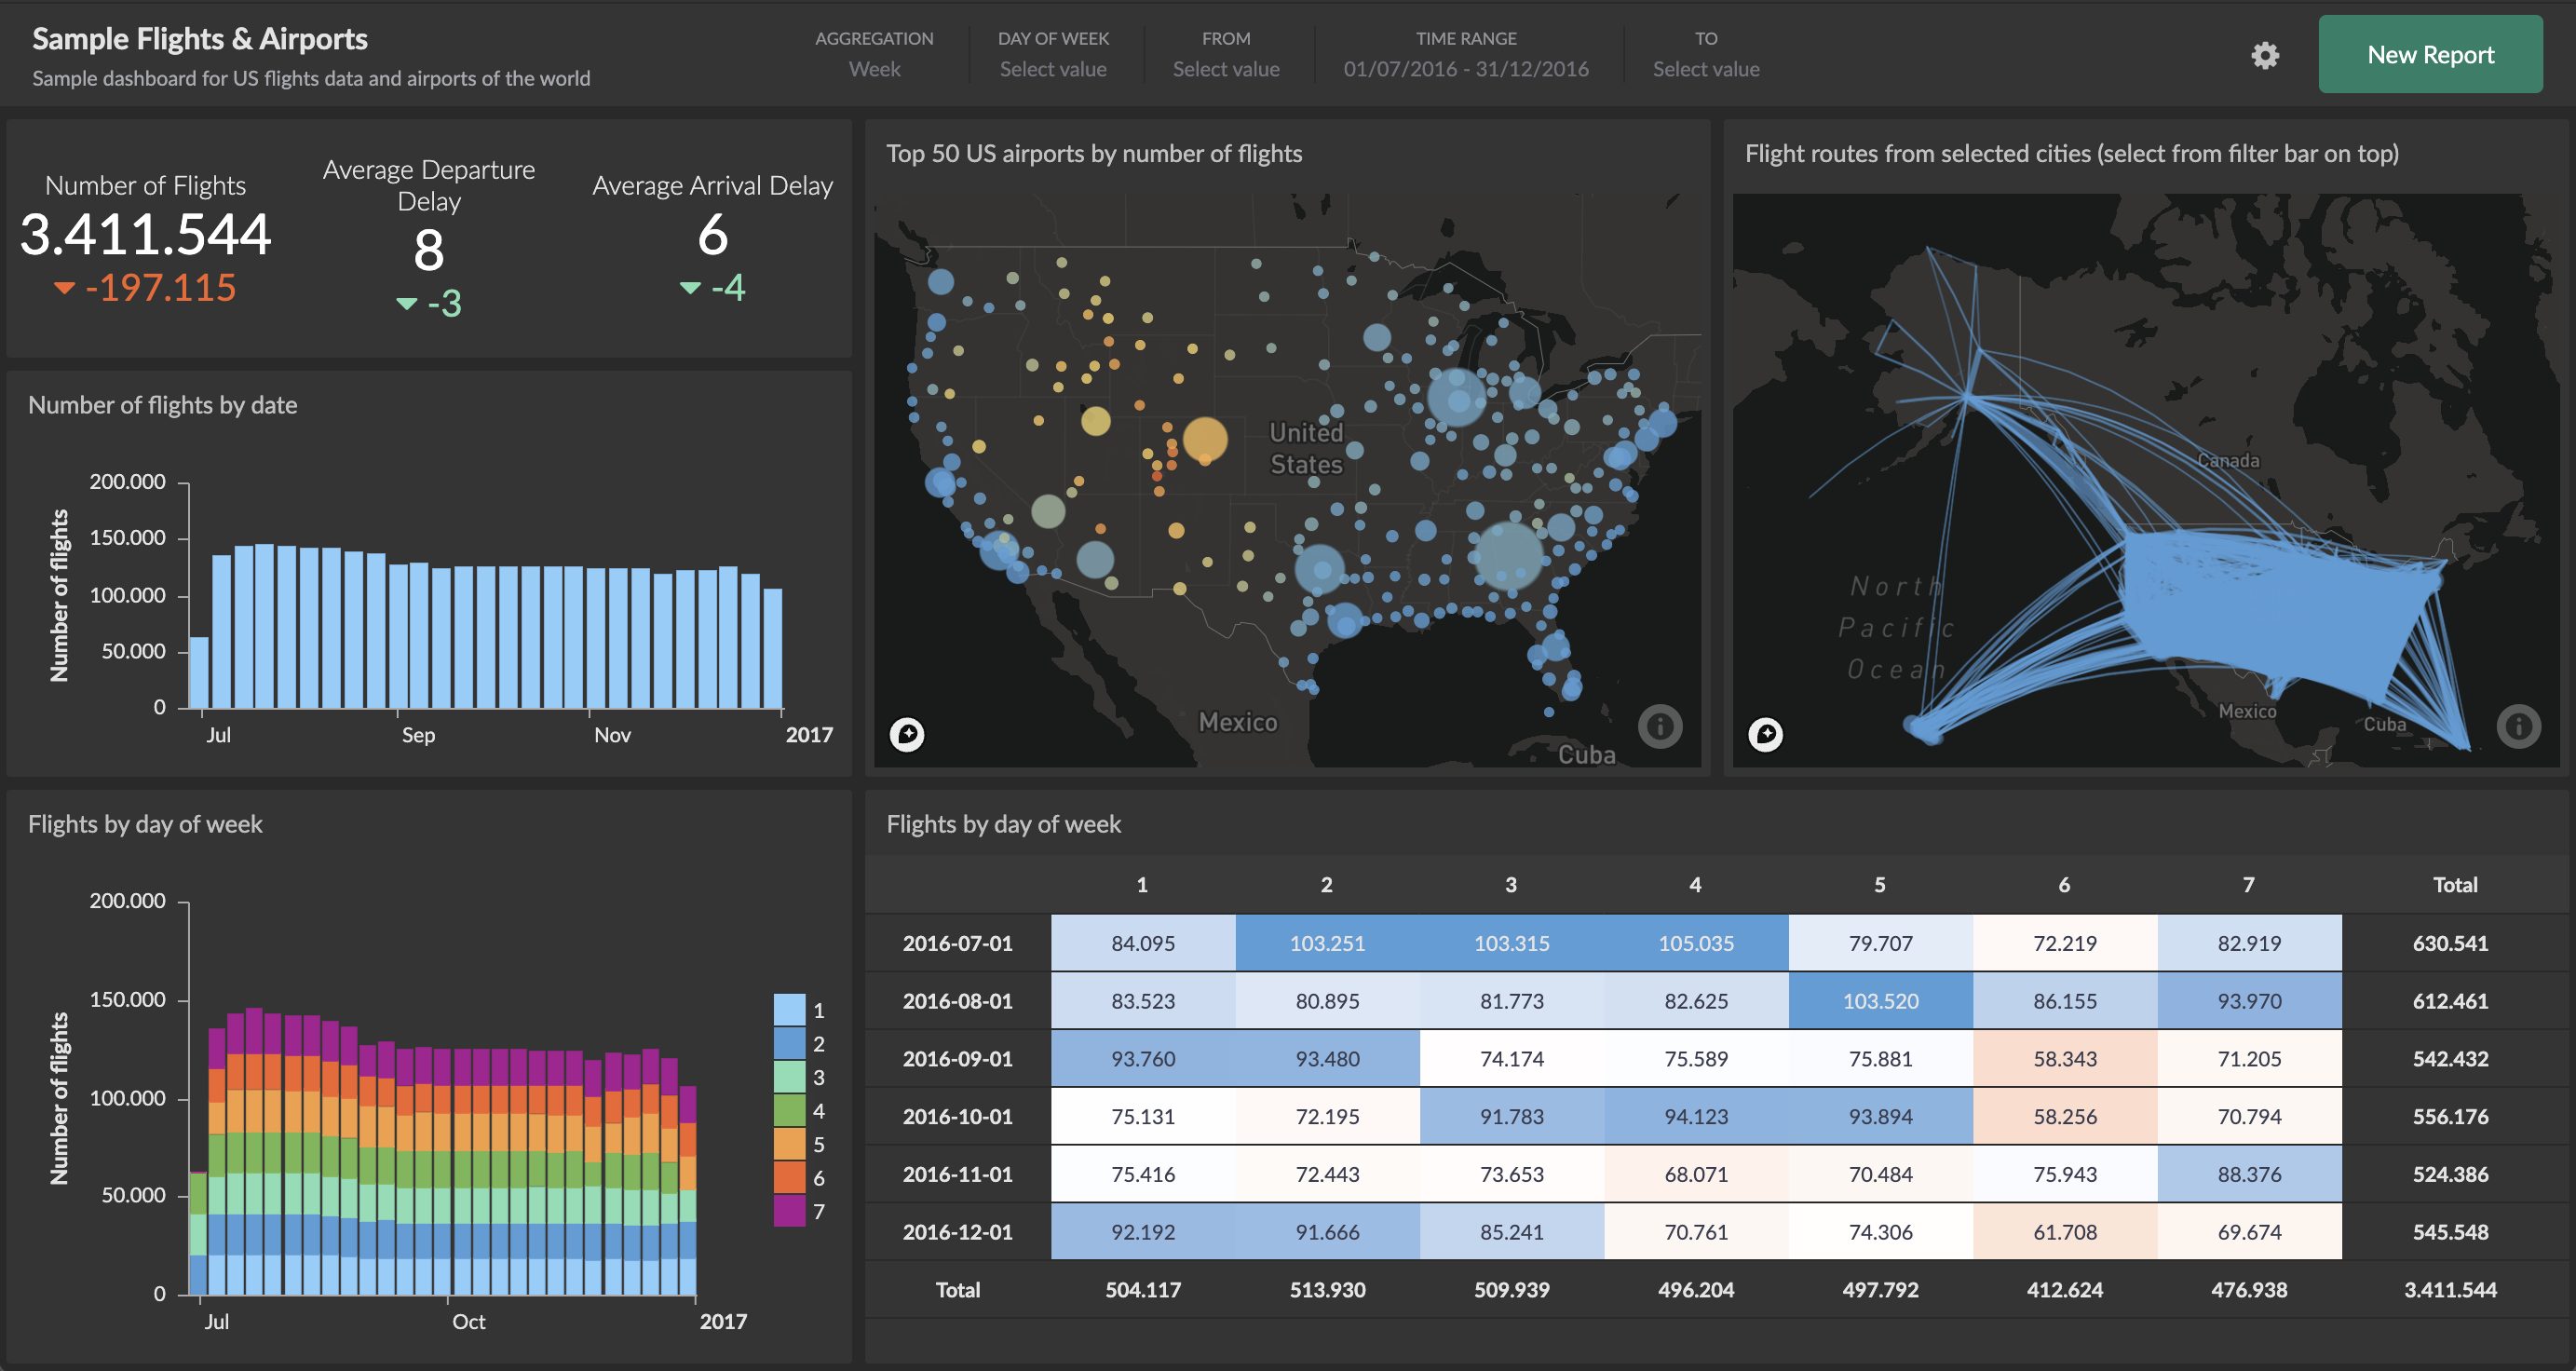
Dashboards can be interactive, such that users can use filter controls to change the data shown. The key to this functionality are filters, used via Cluvio-specific filter expressions). Cluvio has some built-in filters and enables analysts to create a variety of custom filters.
A dashboard's filter bar always contains the union of all interactive filters used in any of the reports on the dashboard. The filter bar is highlighted below.
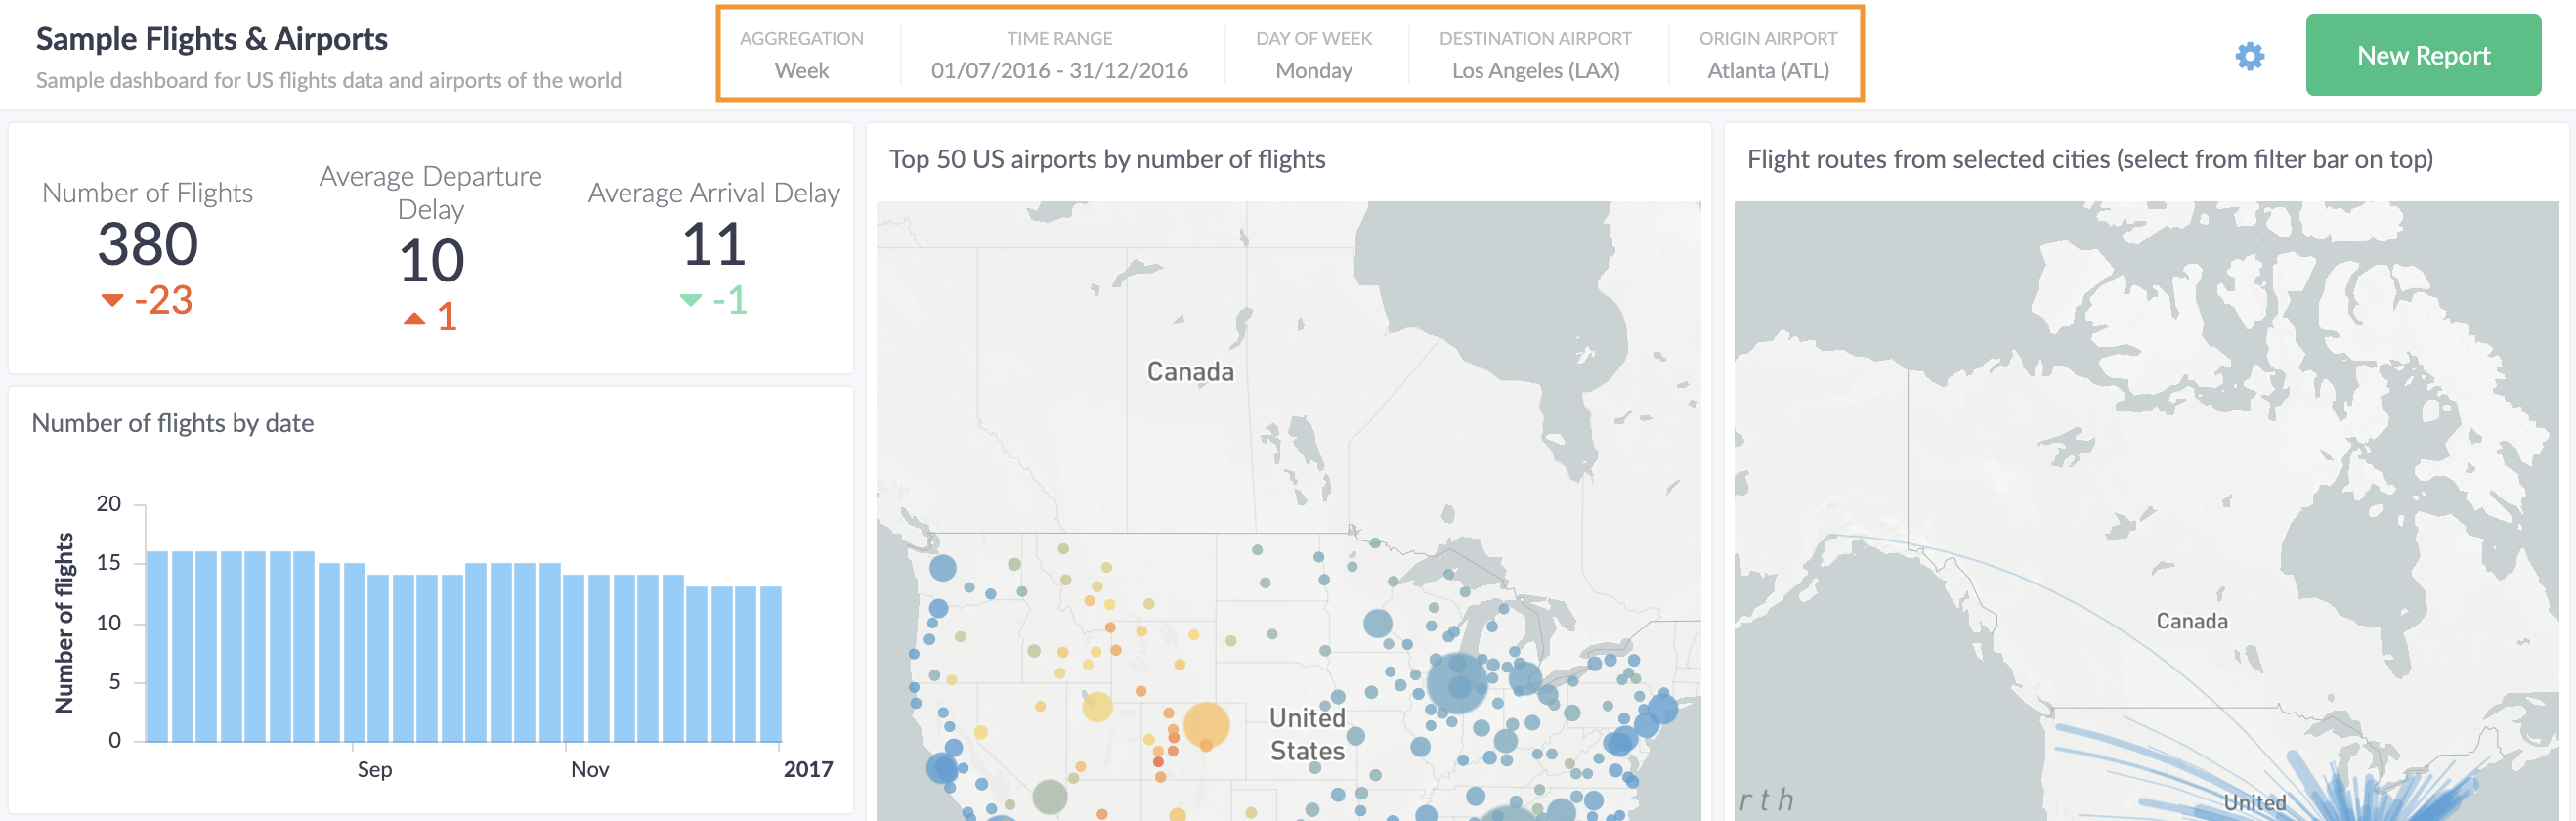
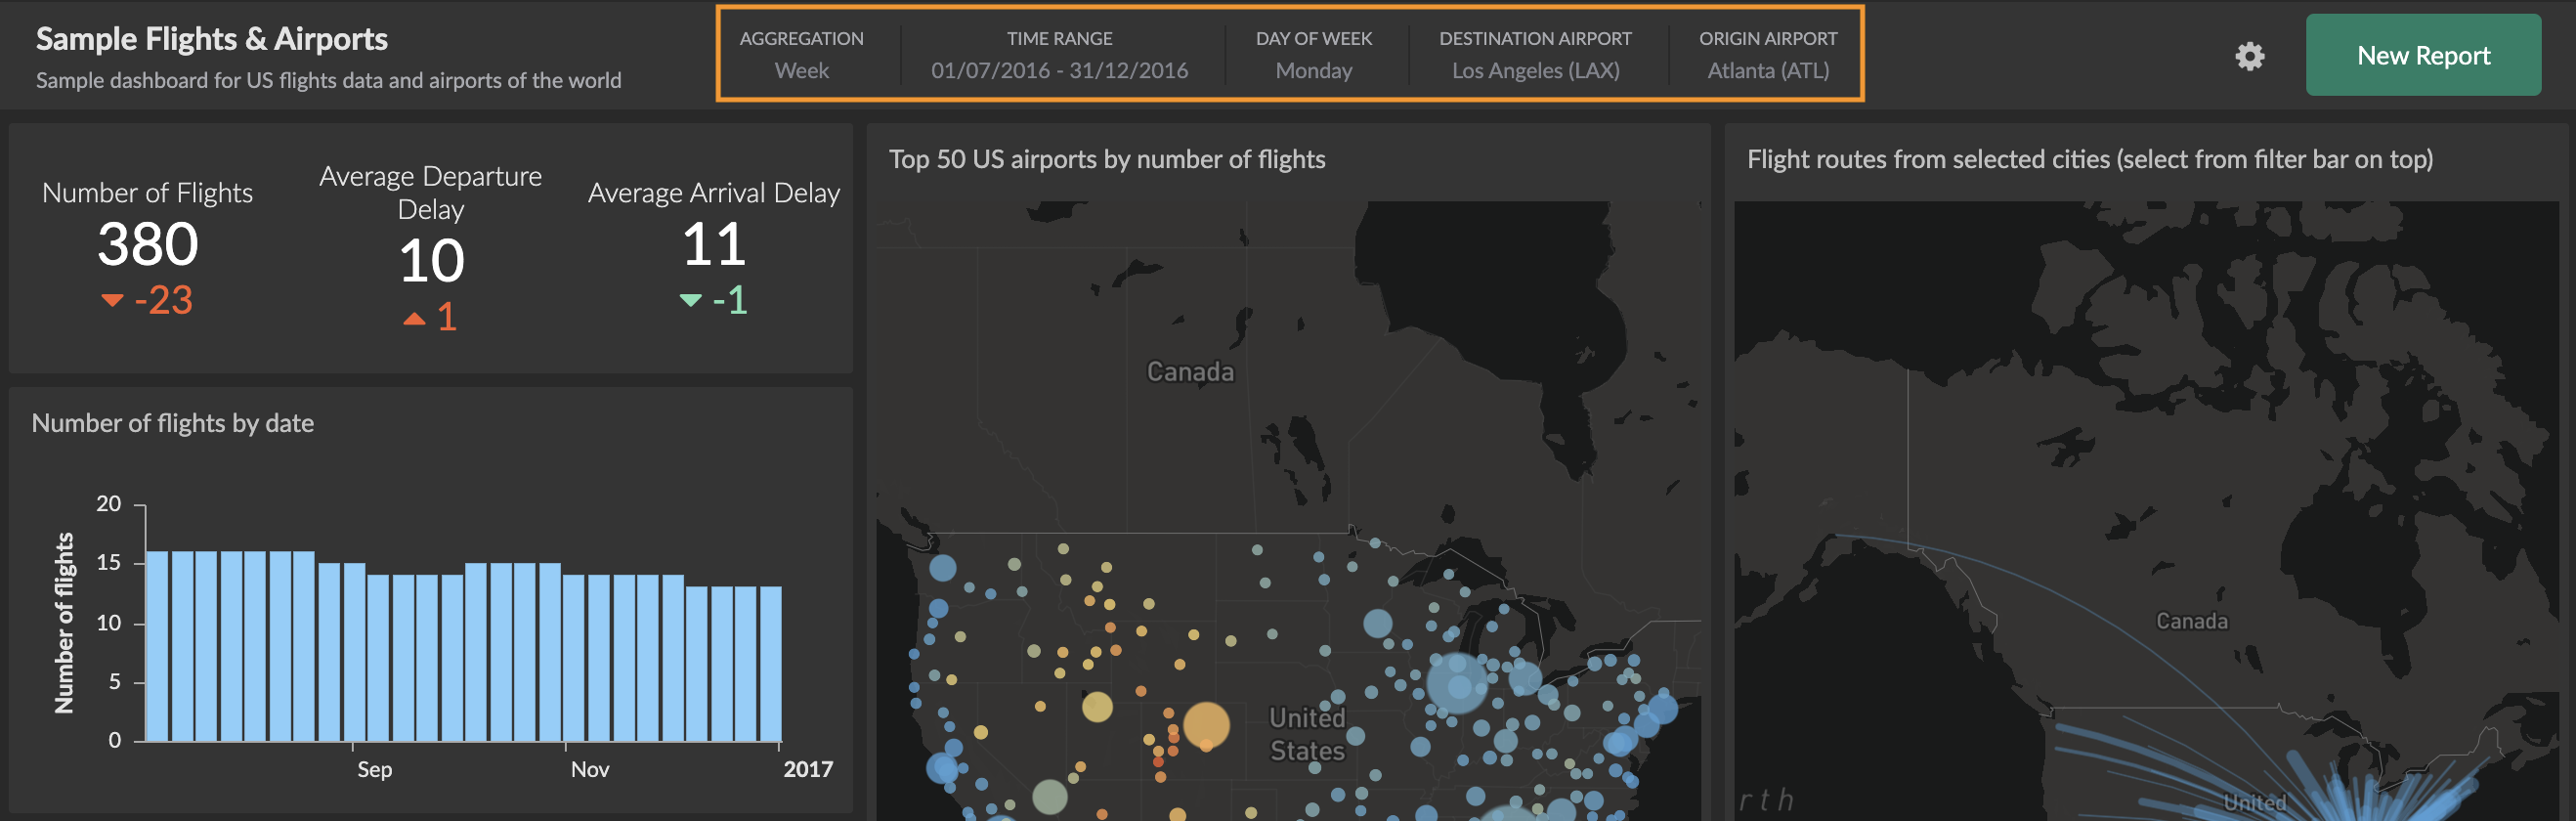
Clicking on the filter bar reveals the filter controls that allow changing the individual filters' selection:
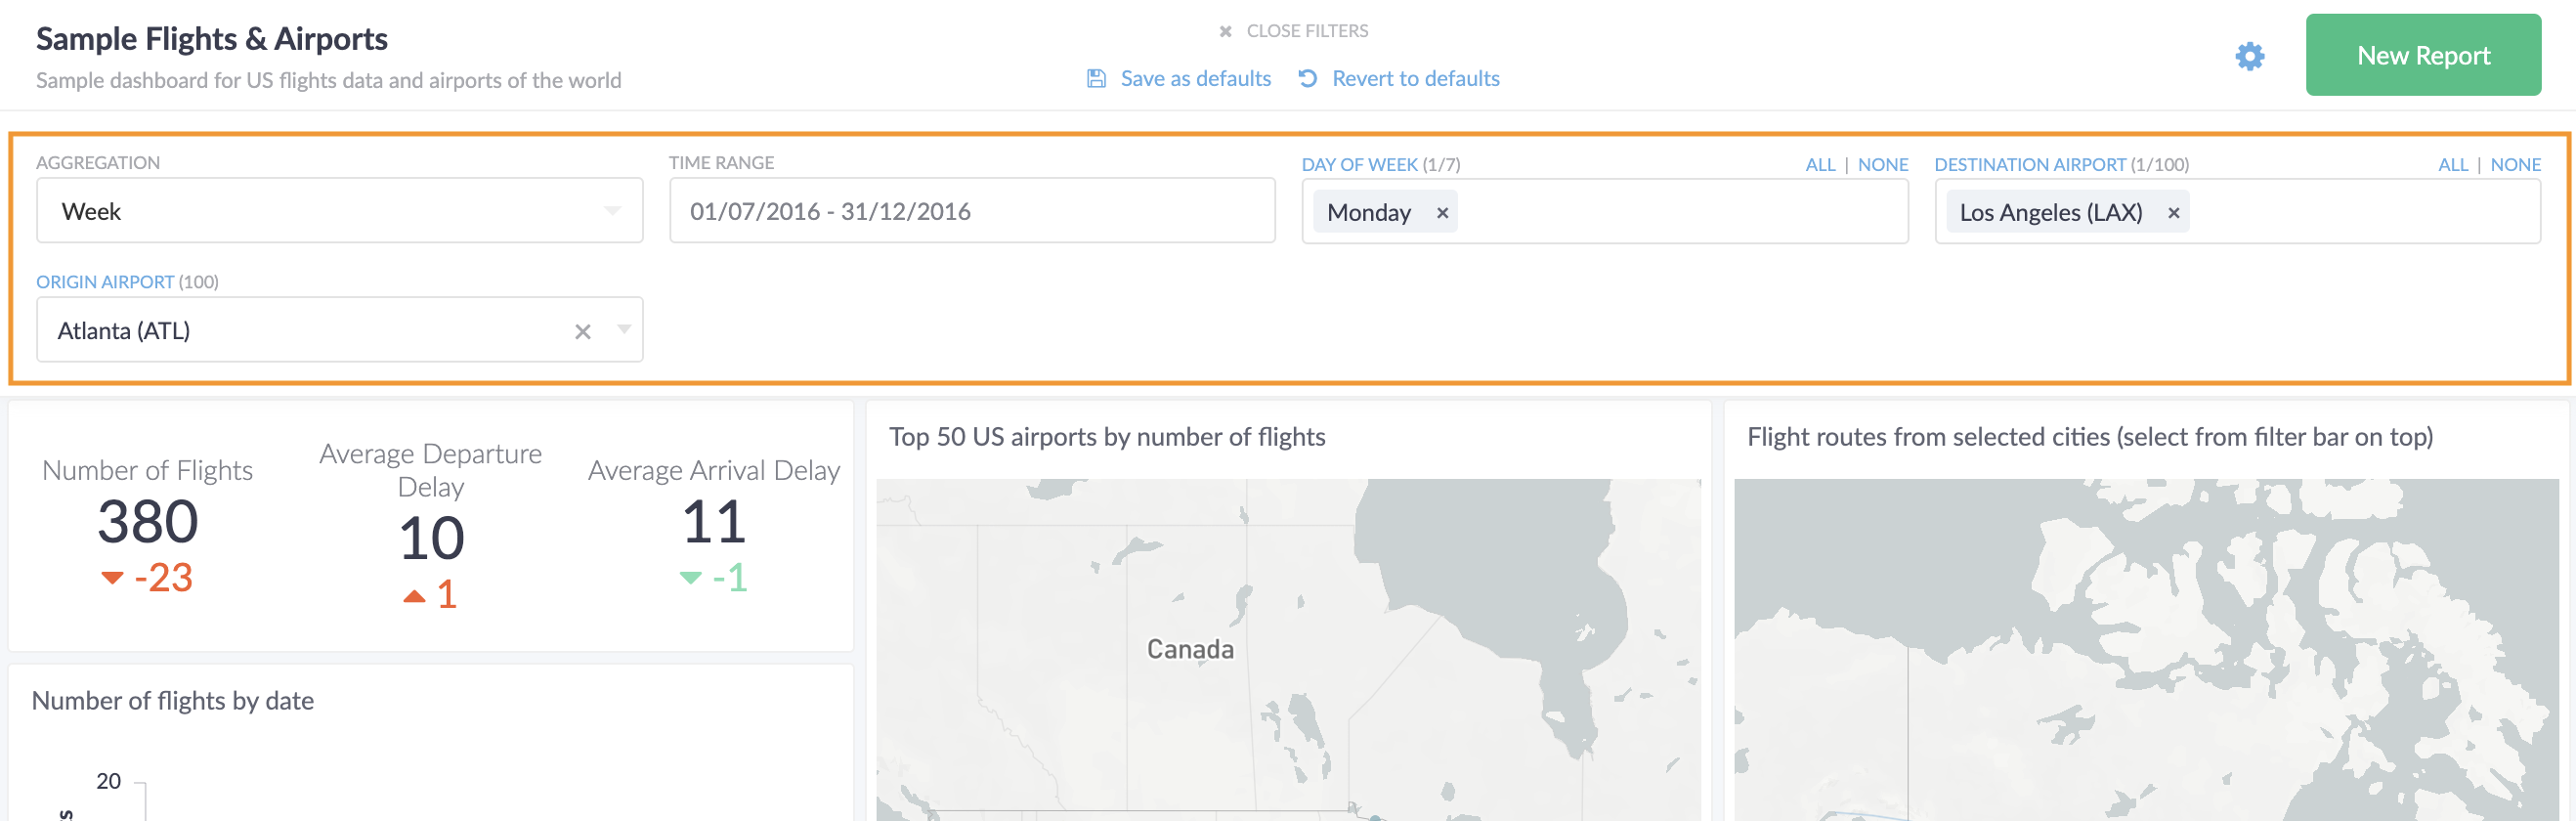
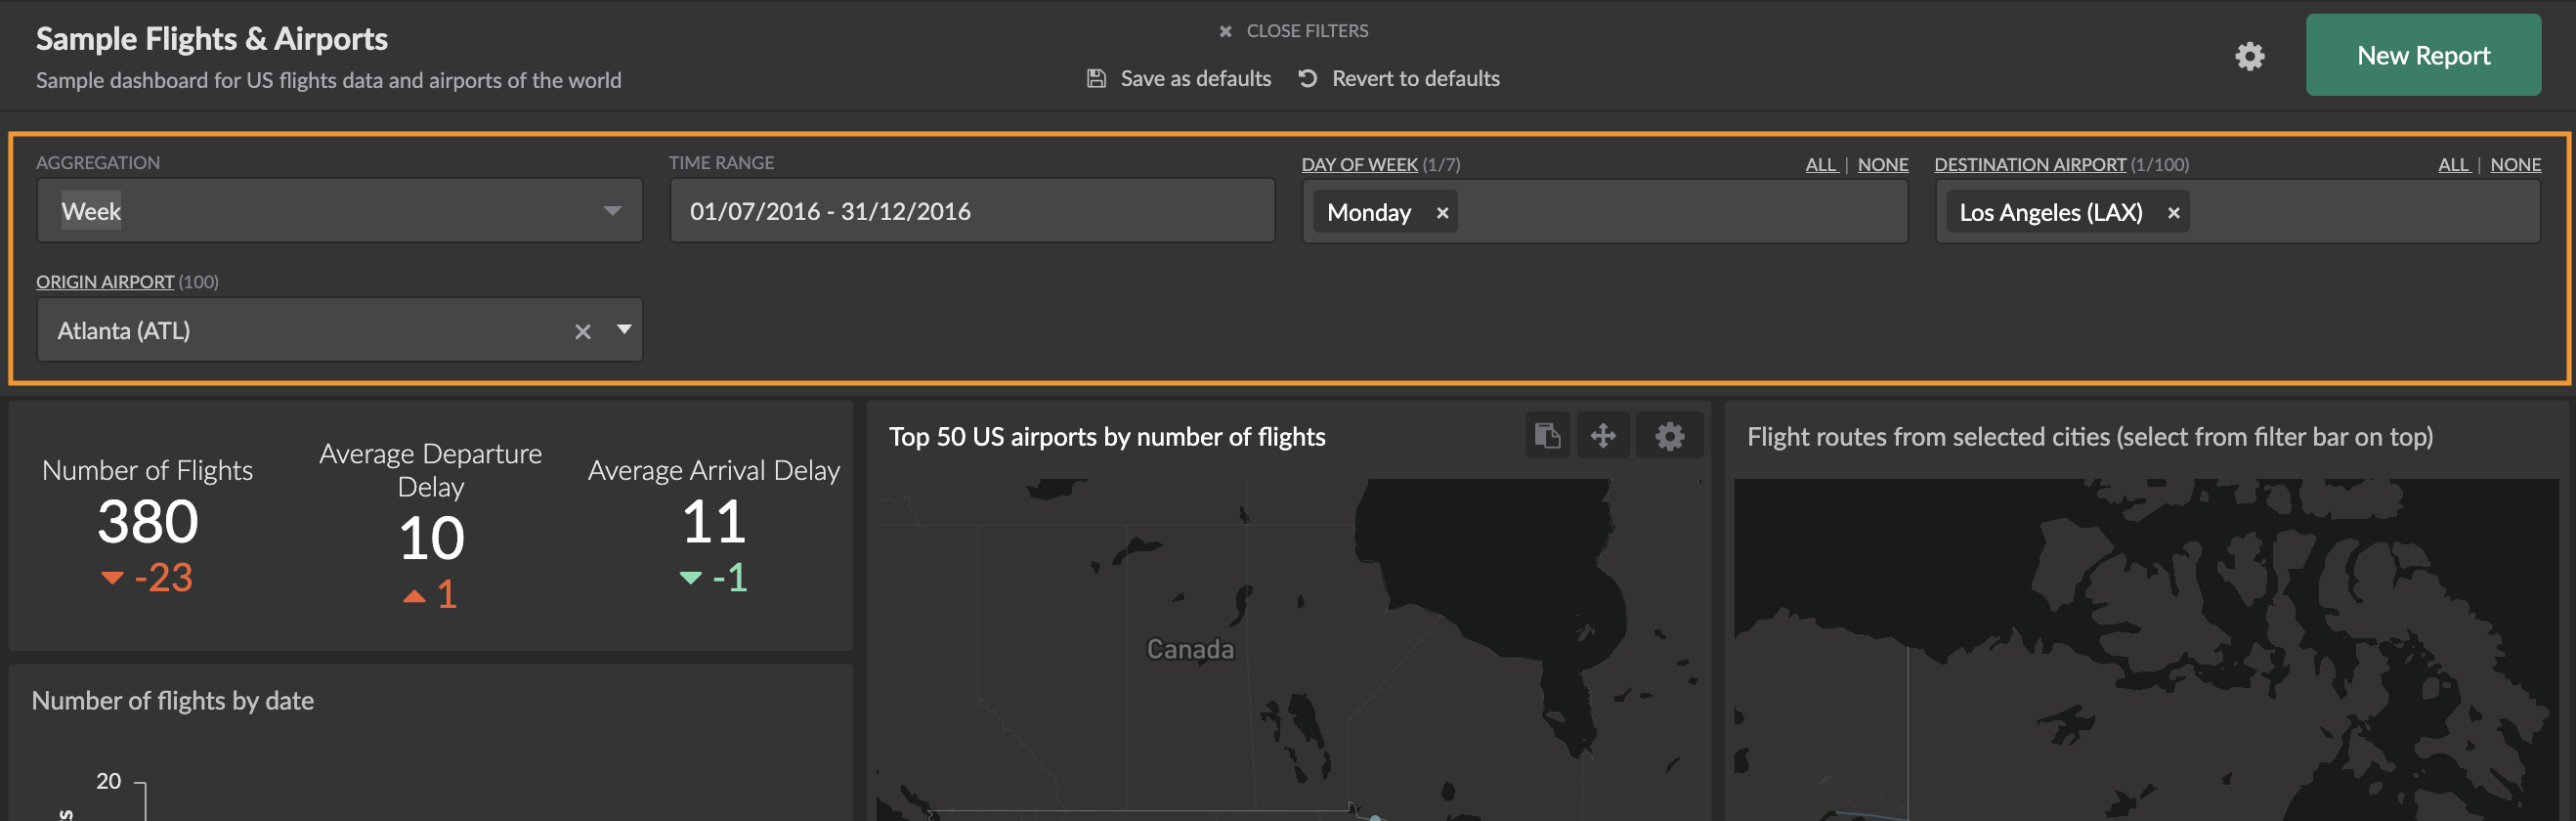
Changing the selection of a filter affects all reports on the dashboard that use the filter. The currently selected values in the filter bar can be saved as the defaults for the dashboard - this will be the selection used when any user opens the dashboard.
Data Caching
To improve the performance of dashboards and reduce the load on your database or data warehouse, the data of each report are cached for every used combination of selected values in the filter bar. Switching to a different combination of selected values results in the reports using cached data (i.e. without running any SQL queries) for that particular selection, as long as you or any other user with access to the same dashboard recently accessed the dashboard with the same selected values.
The cached data is used for up to 24 hours. By configuring the refresh rate on an individual dashboard, report or filter, the maximum age of cached data can be reduced. The lowest possible refresh rate that is available depends on your subscription plan (see Plans Comparison).
New Dashboard
To create a new dashboard, select New Dashboard on the dashboards overview
page.
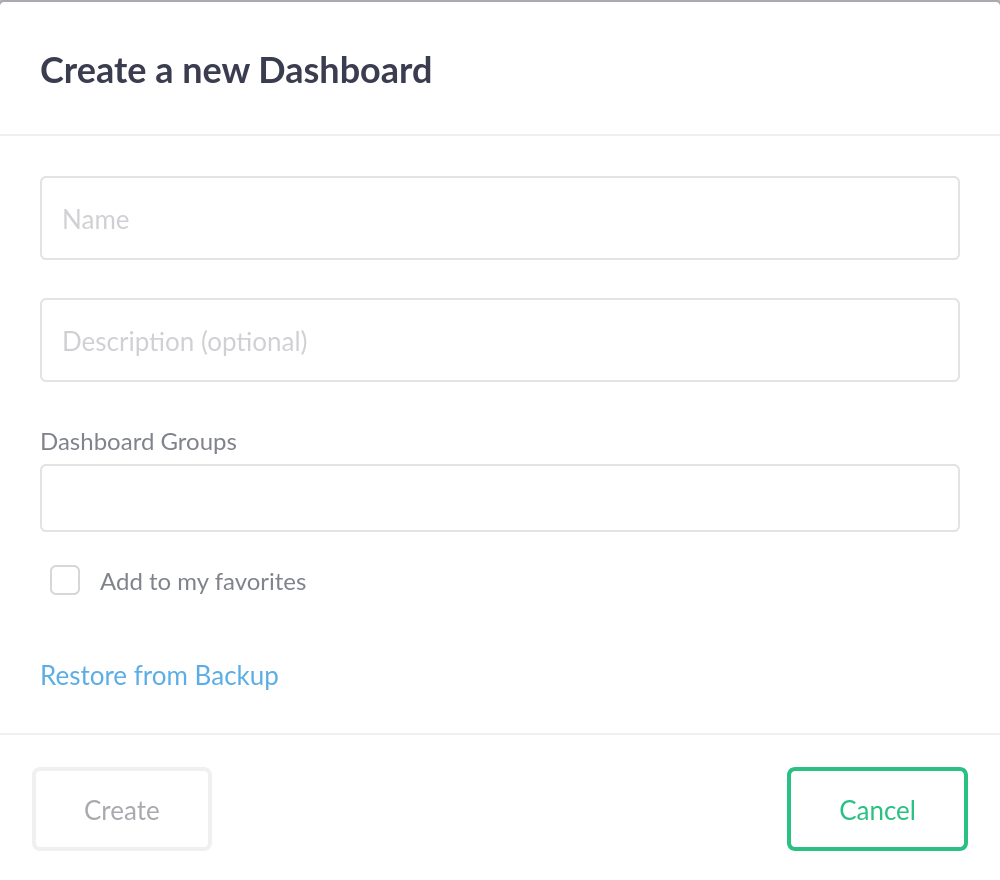
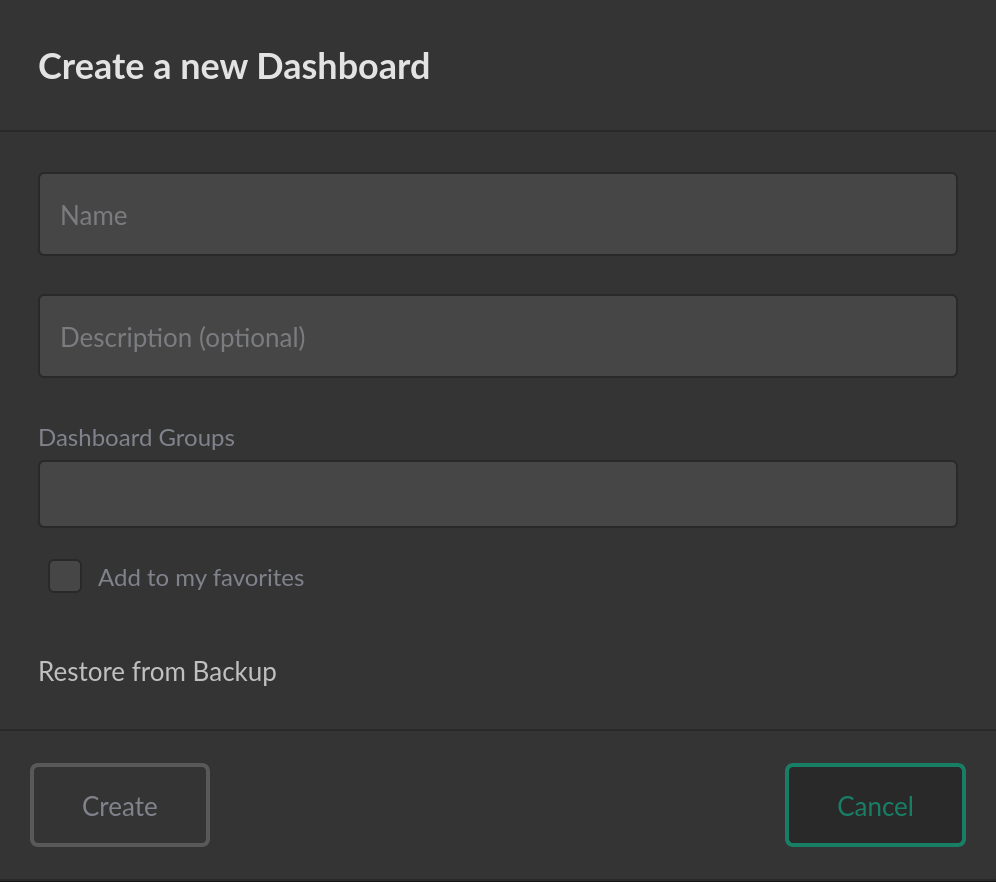
You can optionally give the new dashboard a description and assign it to existing dashboard groups.
If dashboard backups are enabled for your account,
the Restore From Backup option is available to create a dashboard from a JSON file.