Dashboard Actions
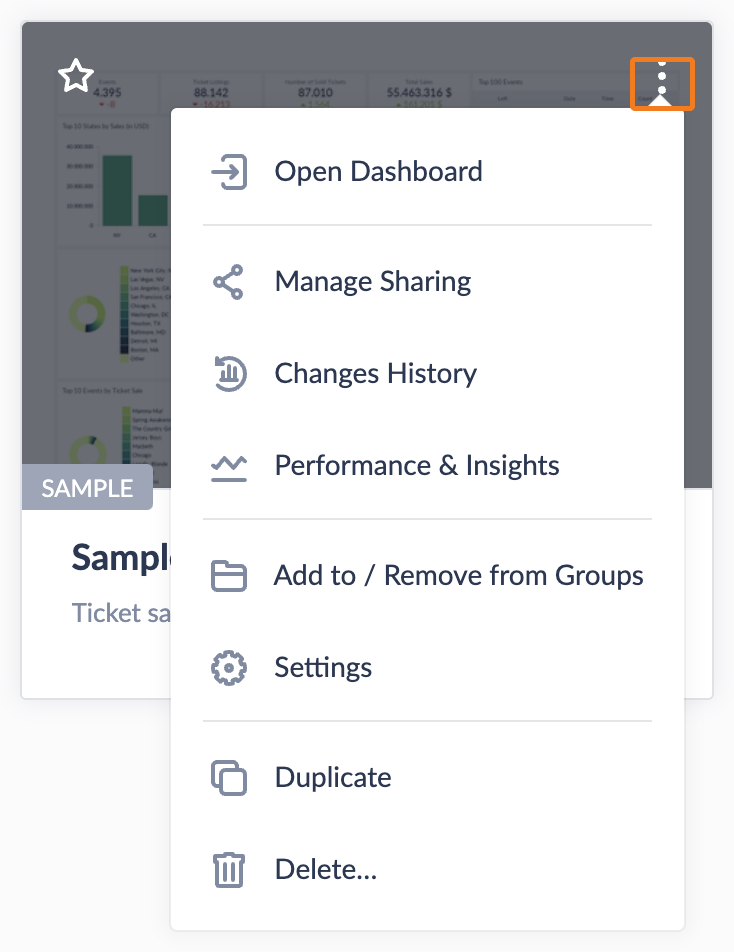
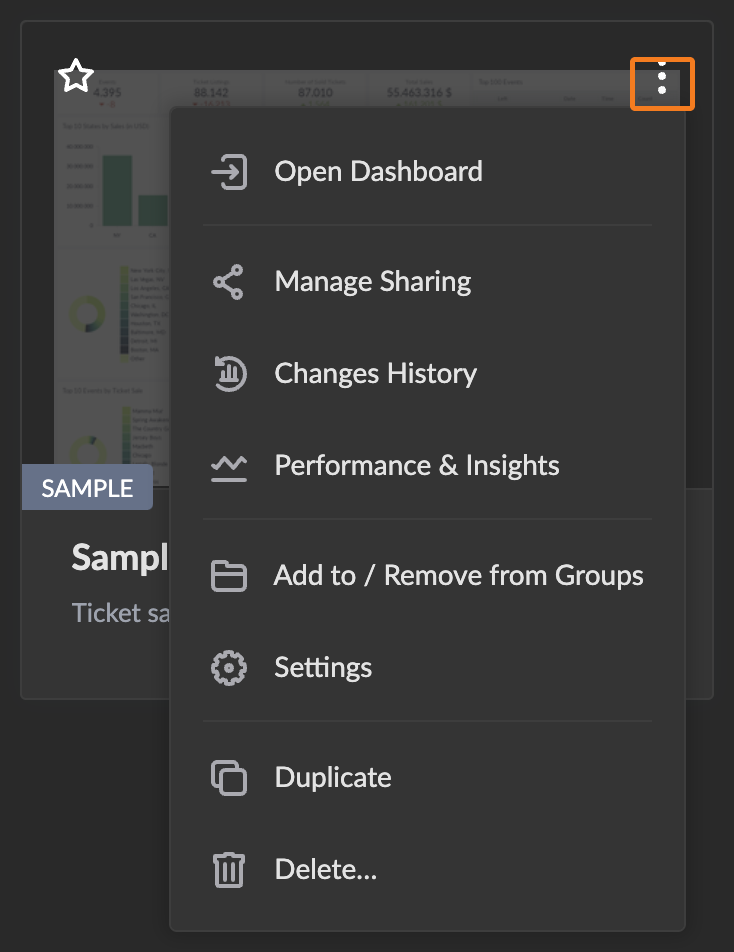
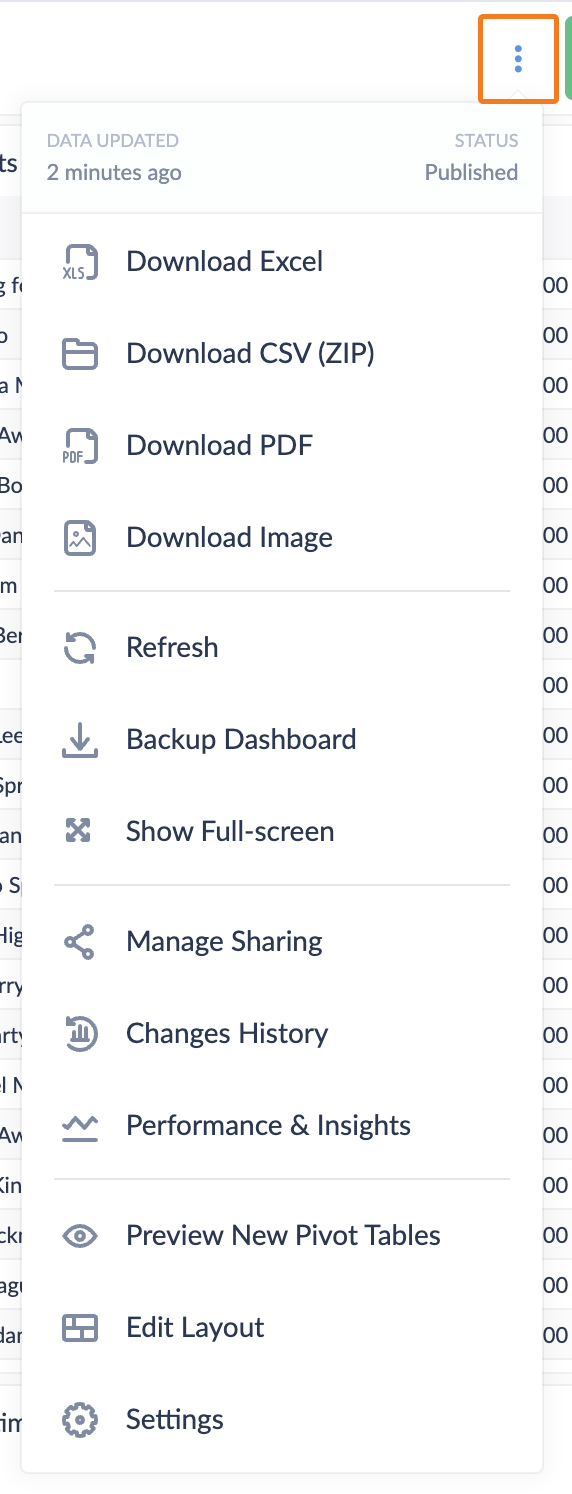
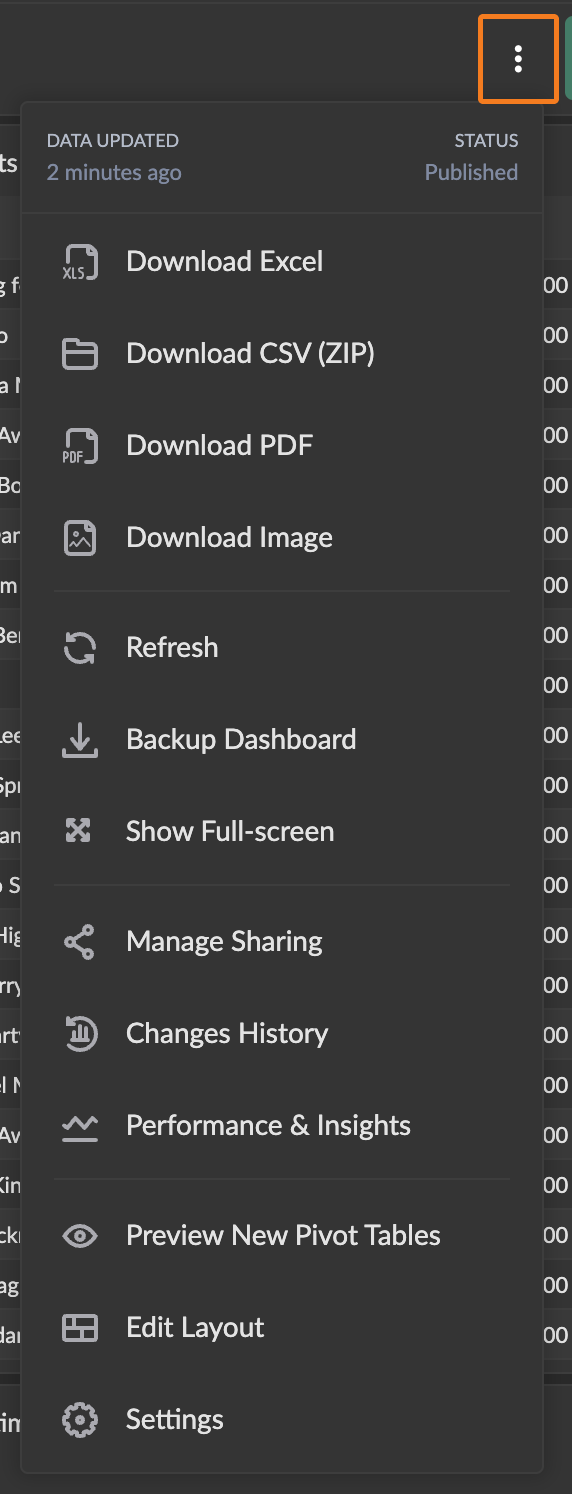
Each dashboard has a dropdown menu with actions for managing, exporting, and sharing it. The menu is available both on the dashboards overview page and when viewing a single dashboard. Some actions appear only in one of these contexts.
| Dashboards Overview | Single Dashboard View |
|---|---|
  |   |
Viewing and Navigation
Open Dashboard opens the dashboard. On the overview page, you can also click the dashboard's thumbnail or name.
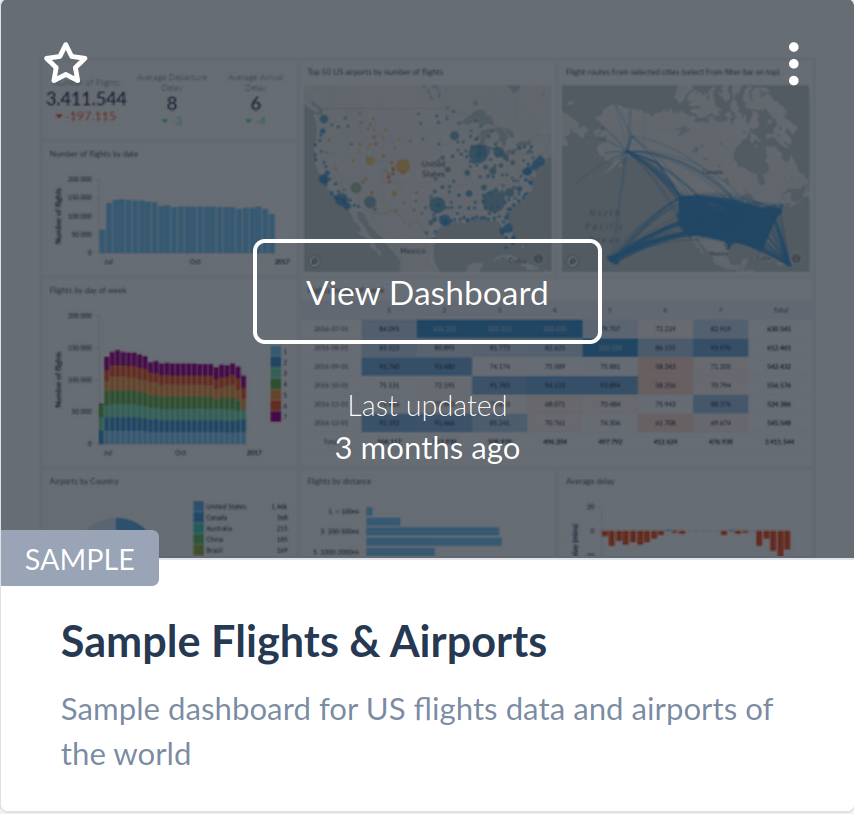
Show Full-screen removes all chrome and navigation, filling the entire screen. Ideal for wall-mounted displays or presentations.
Edit Layout opens the layout editor to rearrange and resize the dashboard's tiles.
Changes History opens the dashboard's change history, where you can review past edits.
Settings opens the dashboard settings dialog where you can configure the name, refresh rate, filters, and monitoring.
Organizing
Add to / Remove from Groups lets you assign the dashboard to one or more groups.
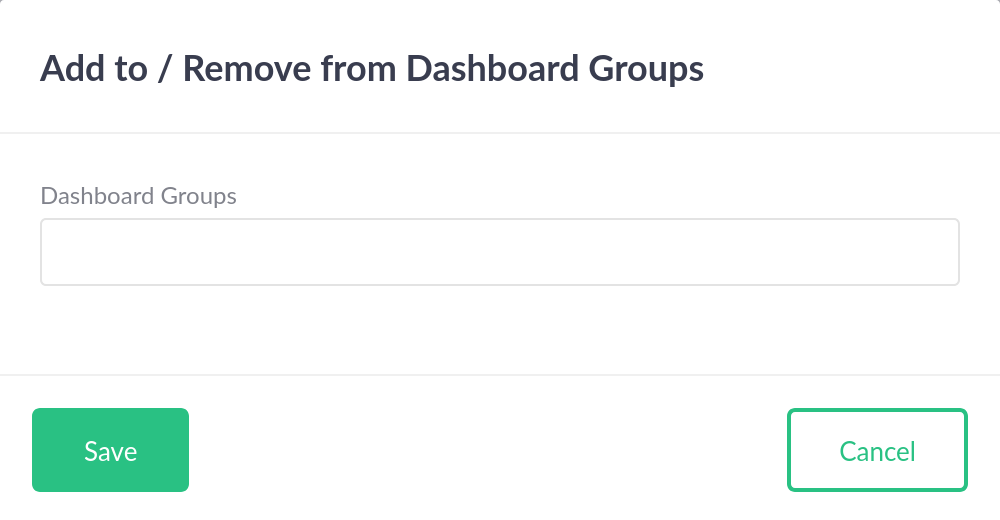
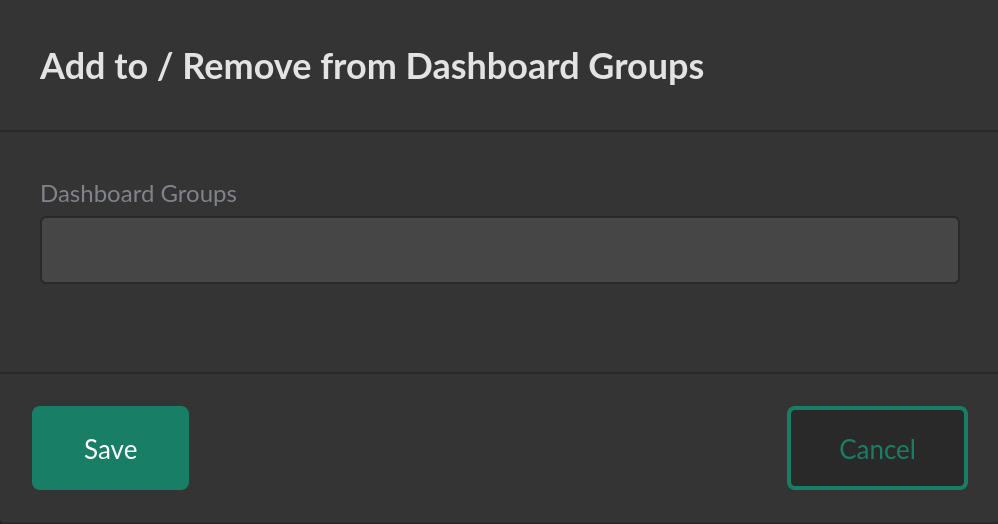
Duplicate creates an independent copy of the dashboard and all its reports. The copy can be used as a starting point for a new dashboard with a similar set of reports.
Refresh re-executes all SQL queries on the dashboard, replacing cached data. Any currently running queries for the same filter parameter combination are cancelled before new ones start.
Query cancellation is best-effort — running queries are not guaranteed to stop on your database before new queries start.
Delete permanently removes the dashboard. You're prompted to confirm first.
Exporting
Download PDF renders the dashboard as a PDF document. The page size is configurable in dashboard settings.
Download Image renders the dashboard as a PNG image.
Both actions open a progress dialog and prepare the file in the background.
If the dashboard does not have current data when the download starts — the first view of the day, or a filter combination nobody has used yet — the dialog shows Waiting for data while its reports run their queries. Rendering begins once the results are in, so the file shows the dashboard's data rather than a dashboard still loading.
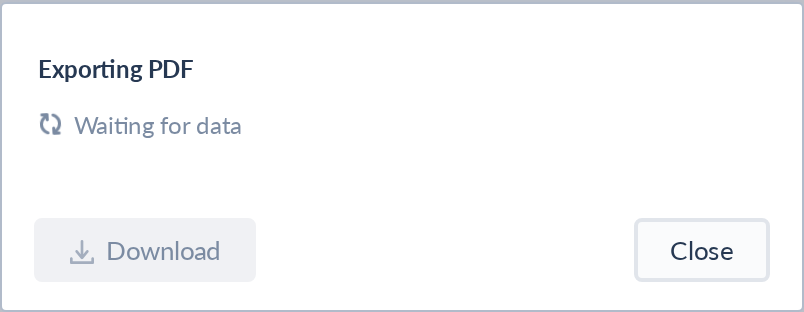
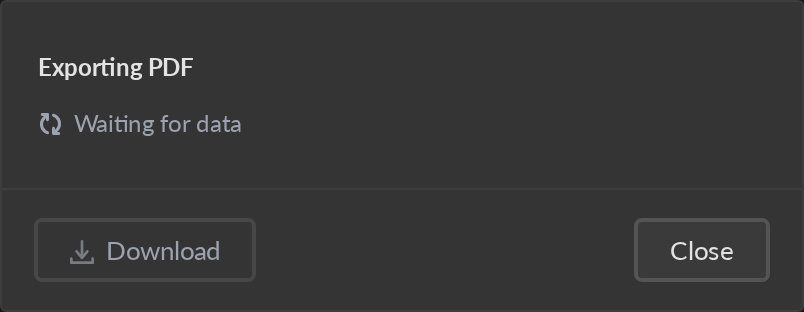
A download waits for as long as its queries are allowed to run on your plan, and never more than 15 minutes. After that it renders what is there, which is what the dashboard itself would show at that moment.
Download Excel exports the data from all reports as an Excel workbook with one sheet per report. The first sheet is an Info sheet listing the dashboard name, a link to the live dashboard, when and by whom the export was generated, the applied filter values, and the data timestamp of each report.
Excel export is not available on the Free plan (see Plans Comparison).
Download CSV (ZIP) exports the data from all reports as a ZIP archive with one CSV file per report. The archive includes a README.txt with the same export details as the Excel Info sheet.
Sharing
Manage Sharing opens the dashboard's management page, where you handle all sharing from a single place:
- Share with users in your organization by assigning the dashboard to user groups, making it visible to their members.
- Sharing links & embedding for distributing or embedding the dashboard externally.
- Scheduled emails that deliver periodic dashboard snapshots as email attachments.
Performance & Insights opens the monitoring view for the dashboard, showing query execution charts, slow queries, and error tracking. This link is available when your plan includes dashboard monitoring.
Backup
Dashboard backup is currently available on request. Contact support@cluvio.com to have it enabled.
Backup Dashboard exports the dashboard configuration as a JSON file. This file can later be used to create a new dashboard from the backup. We recommend downloading a backup before deleting a dashboard.