Histogram Chart
A histogram chart displays a distribution of values from a single numeric column.
The values are partitioned into a series of bins, with each bin visualized as a horizontal or vertical bar. Each bin covers a range of values and a bar's height or width indicates the frequency of data points within the range of the bin.
Data Requirements
The histogram chart is available if the query results contain a numerical column. The values of the column chosen for the histogram are interpreted as the numbers of the distribution to plot. The default chart configuration will try to create sensibly-sized bins. For example, a query result with a numerical column such as
| value |
|---|
| 1 |
| 2 |
| 3 |
| 4 |
| 5 |
| 6 |
| 7 |
| 8 |
| 9 |
| 10 |
produces the following histogram (in the default configuration)


Note that the last bin has a range with an inclusive upper bound (here [9,10])
and thus contains two data points.
Interactive Features
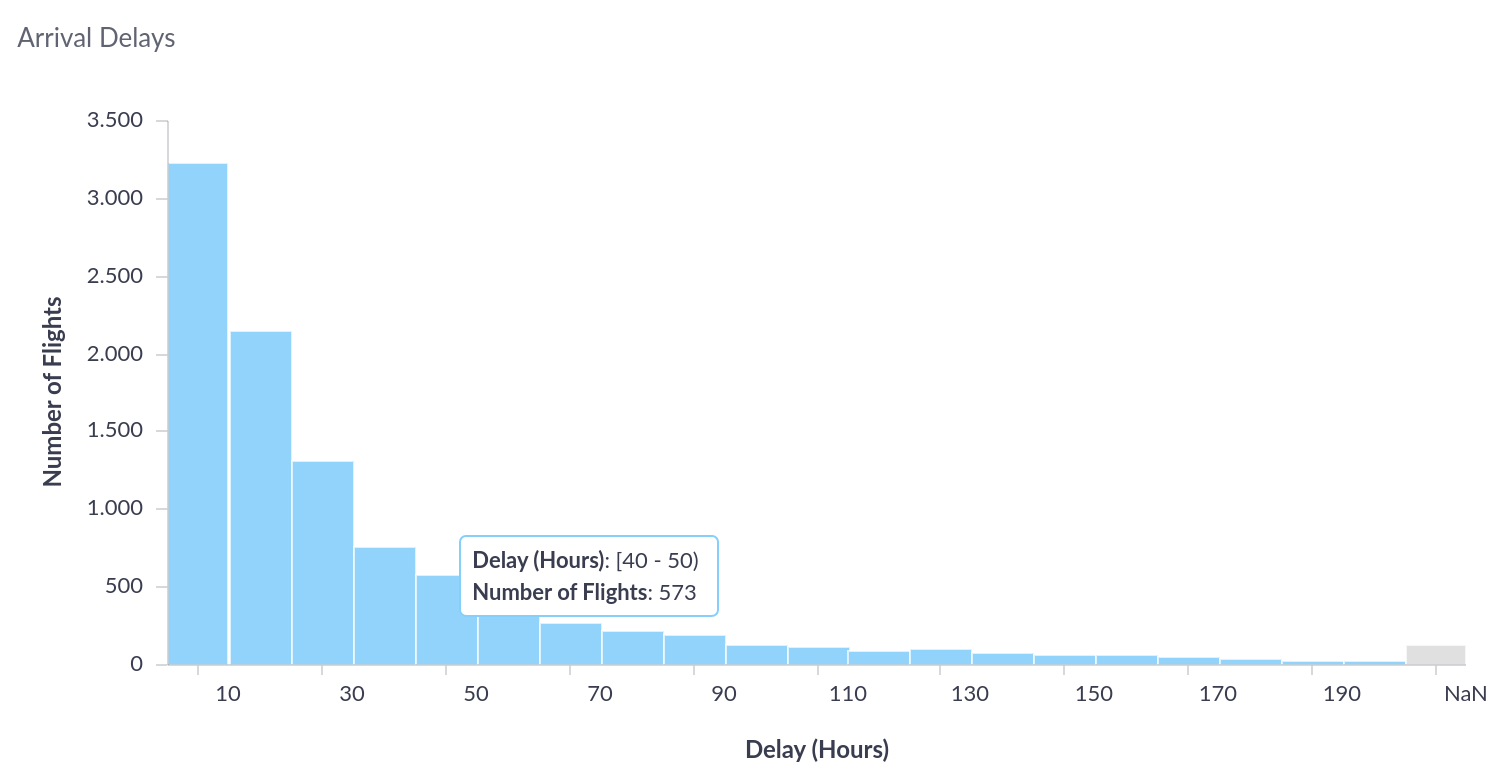
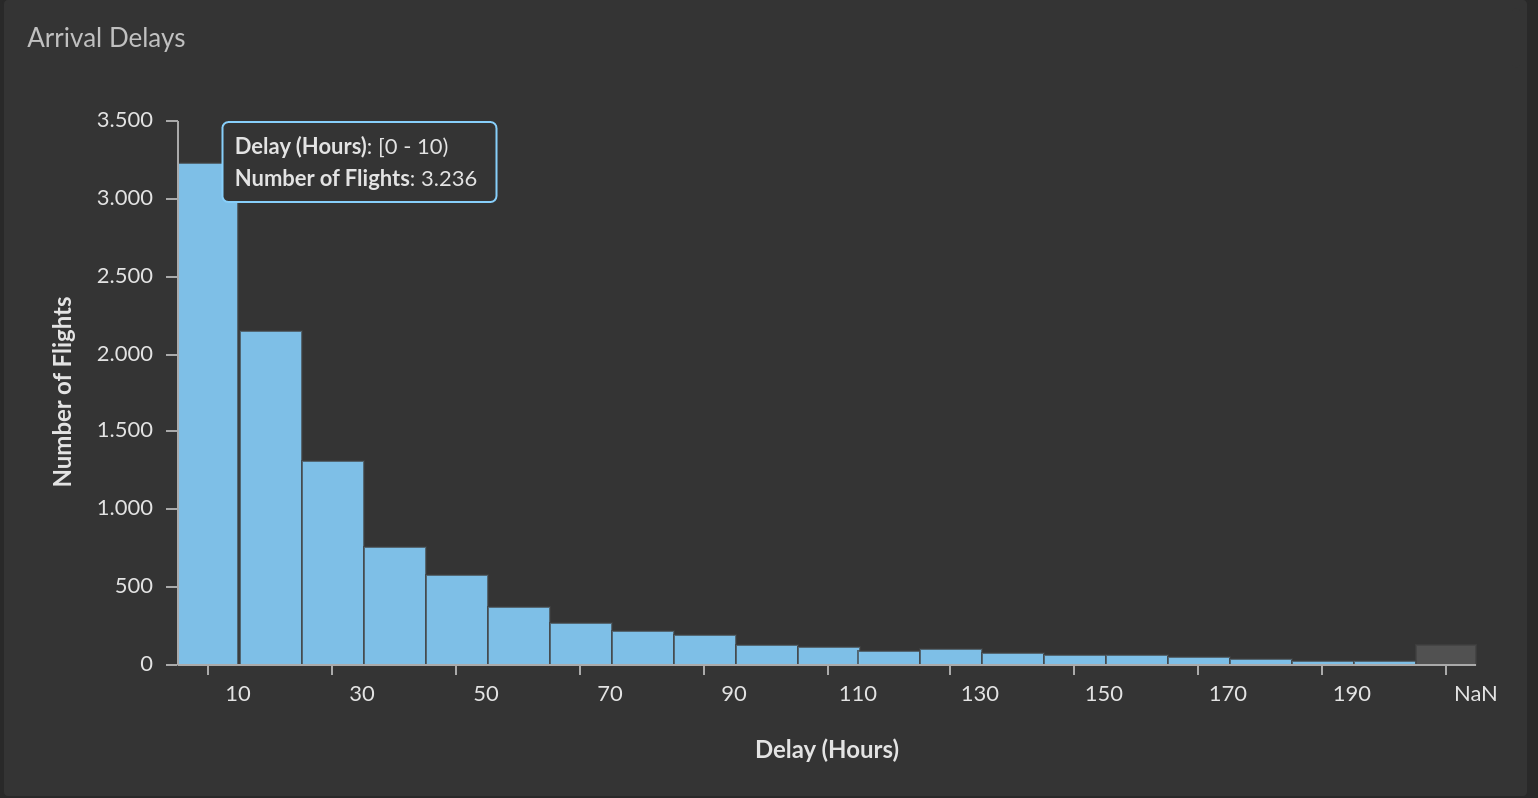
Tooltips
When hovering the cursor over a bin / bar, a tooltip is shown with the range of the bin and the frequency of the contained values.


Configuration
The following visual configuration options are available for the histogram chart:


- S, M, L, XL: Preset sizes for the axis labels and titles.
- Vertical, Horizontal: The orientation of the bins / bars. A horizontal orientation swaps the X/Y axis.
- Tilt X Axis: In the vertical orientation, the X axis labels can be tilted by 45 degrees, which can be especially useful for longer labels.
- Tooltip: Enables or disables tooltips when the cursor hovers over a bin / bar.
Bin Settings
The bin settings of the histogram chart configure the column that is used for the values of the histogram, as well as the partitioning of the bins / bars.


When configuring a fixed Number of Bins, the histogram will have a fixed
number of bins with variably-sized, evenly distributed value ranges for each
bin. In contrast, when configuring a fixed Bin Width, the histogram will have
a variable number of bins with fixed ranges and thus a fixed width for each bin.
If a Min threshold is set, all values lower than the configured threshold are
grouped into an "Underflow bin". Analogously, if a Max threshold is configured,
all values larger than the configured threshold are grouped into an "Overflow bin".
The underflow and overflow bins can be colored differently, see Colors.
Axes Options
The axes options allow setting a title for the X and Y axis of the chart.


Labels
The option Show value labels can be enabled to show the number of values in
each bin directly on the chart, instead of, or in addition to the
tooltips.


Colors
The colors section of the histogram chart configuration defines the color to
use for all bins. If a Min threshold or Max threshold is configured in the
bin settings, a separate color can be chosen for these bins.

