Table Chart
A table chart displays query results as a table, supporting paging, column sorting, column totals and rich value formatting options, including support for custom HTML within a cell for complete freedom of formatting the data or displaying images.
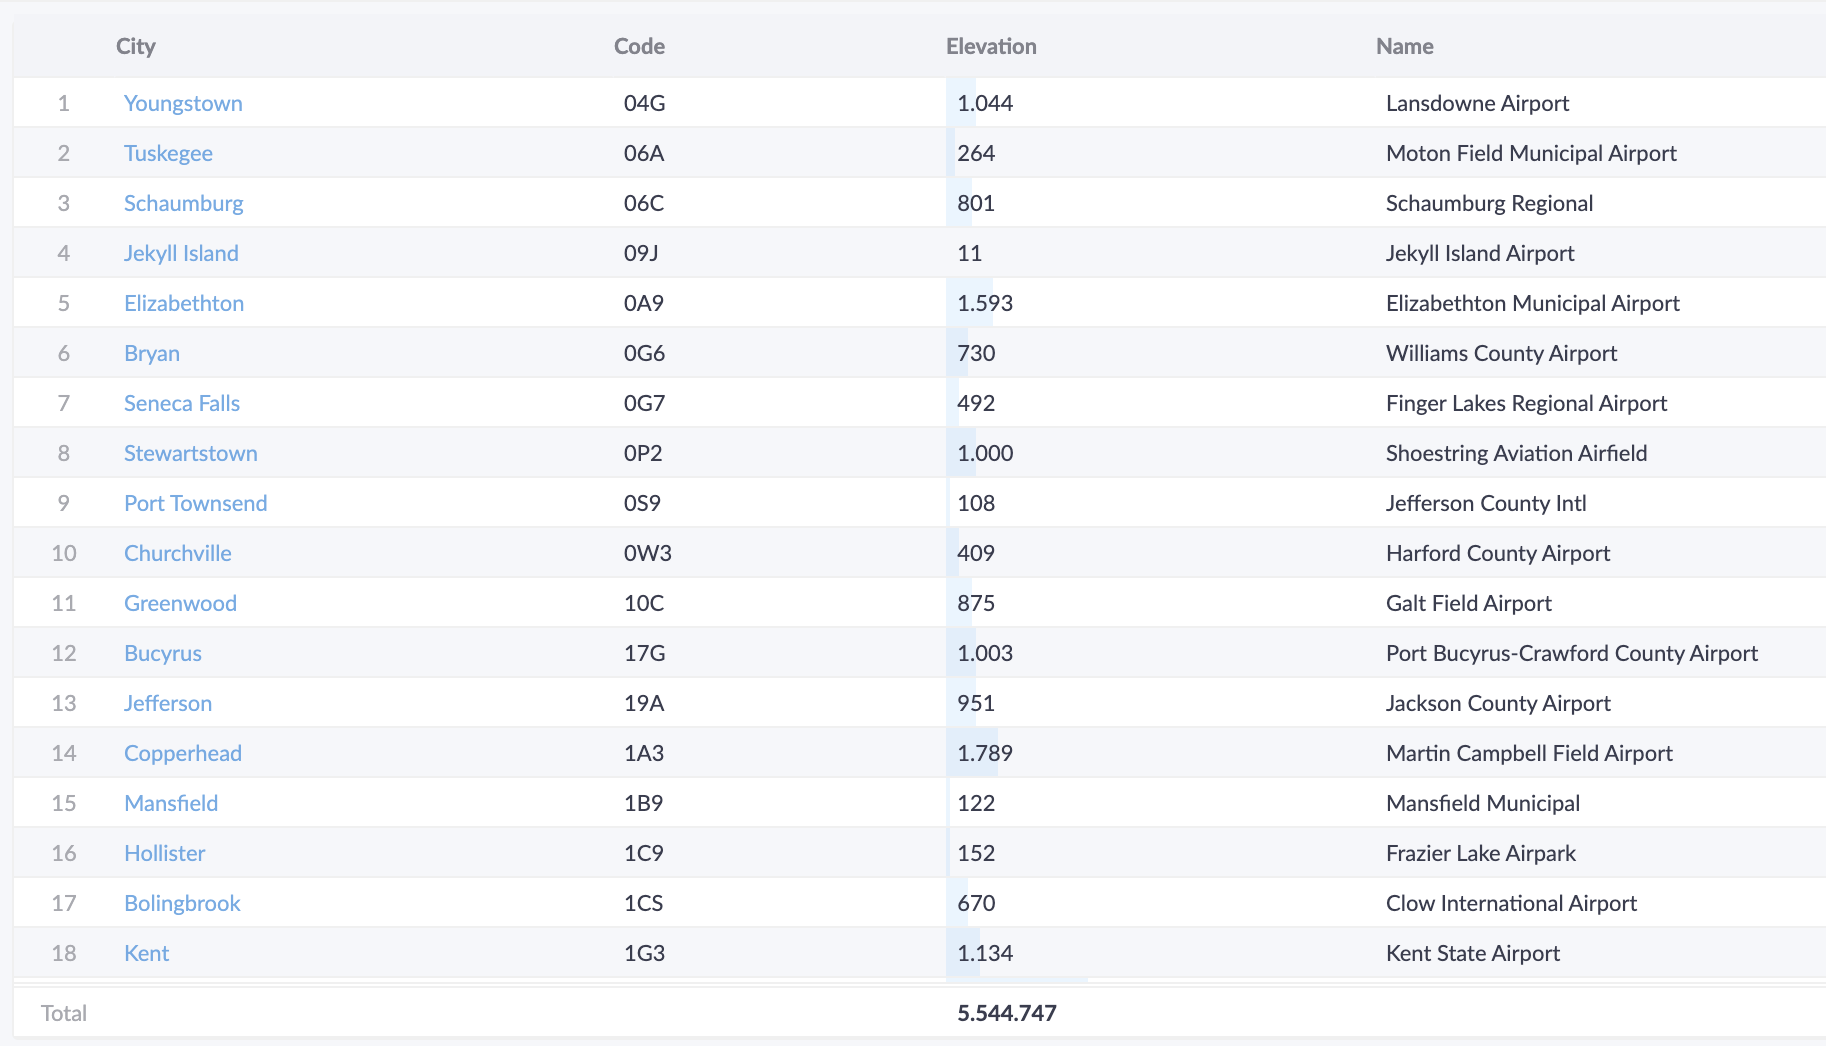
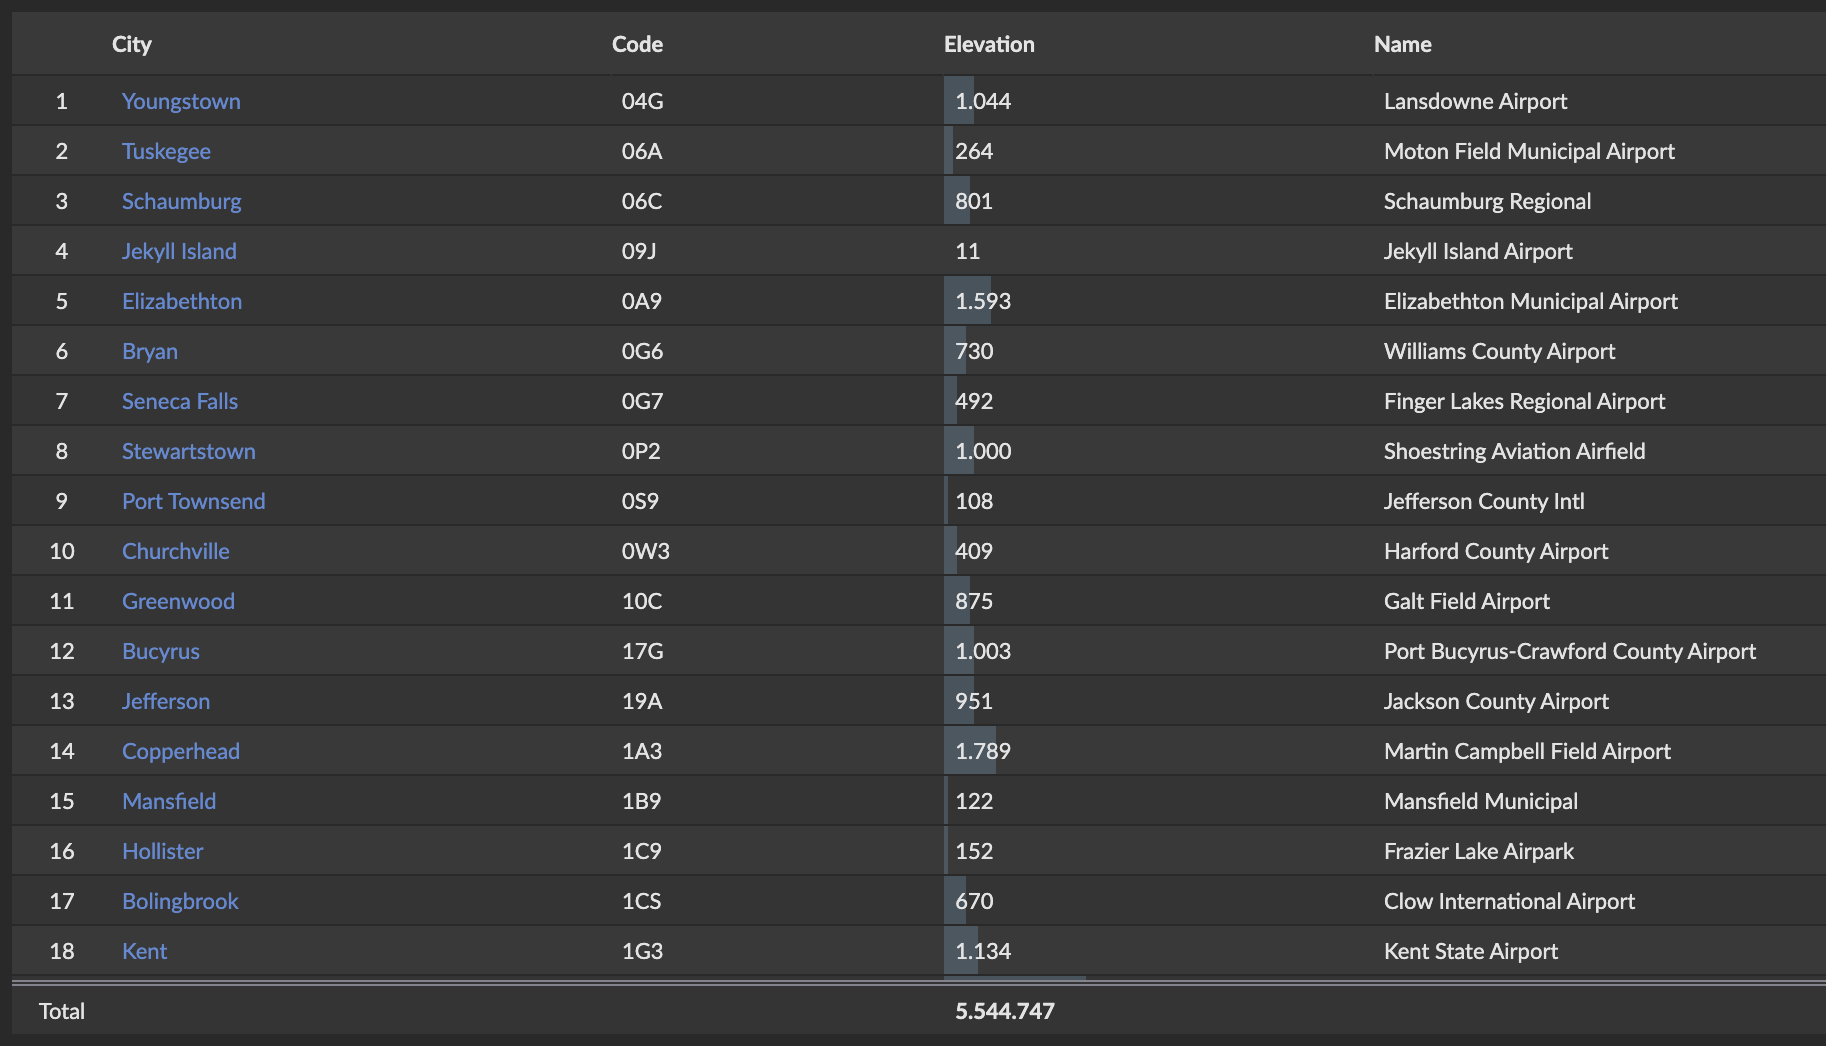
Data Requirements
The table chart is always available. There are no requirements on the result data columns,
except that values of some database-specific column types, such as BINARY, RECORD and
ARRAY are not displayed - these need to be converted to another data type (e.g. textual
or numeric) in a report's SQL query.
Interactive Features
Sorting
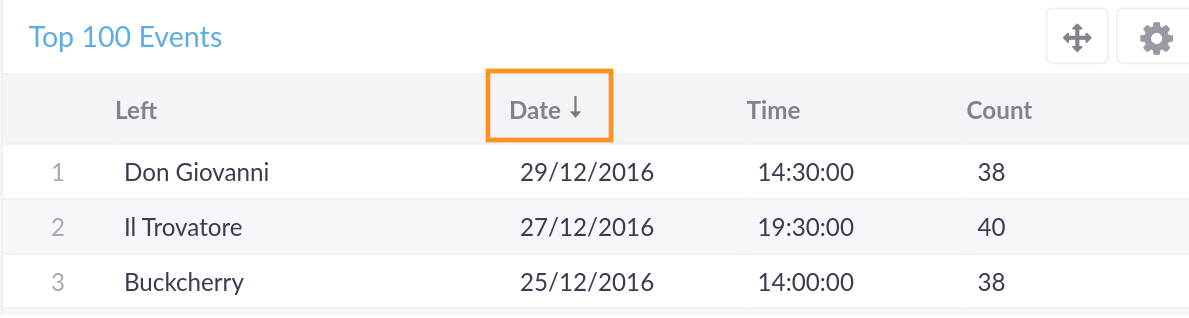
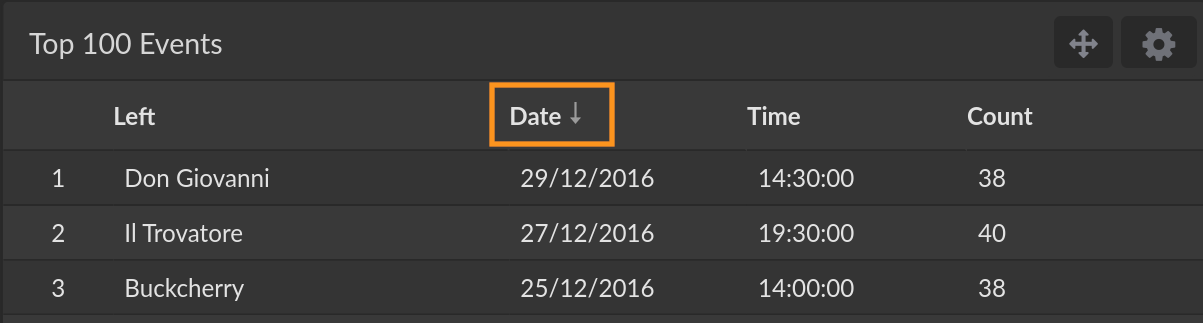
The table can be sorted by one or more columns by clicking on the column header,
or clicking while holding Cmd/Ctrl to add additional columns to the sorting.
To choose the sort order (ascending/descending/original), click multiple times
to cycle through the options. In case the table is paged, the sorting is applied
correctly across all rows and the current page displays the subset of rows
according the the sorting.
Paging
By default a table chart displays 100 rows per page. When there are more
rows, a paging footer at the bottom of the chart shows the current row range,
page navigation, and — on desktop computers — a Show All xxx rows option that
displays the full data set on a single page with regular scrolling.
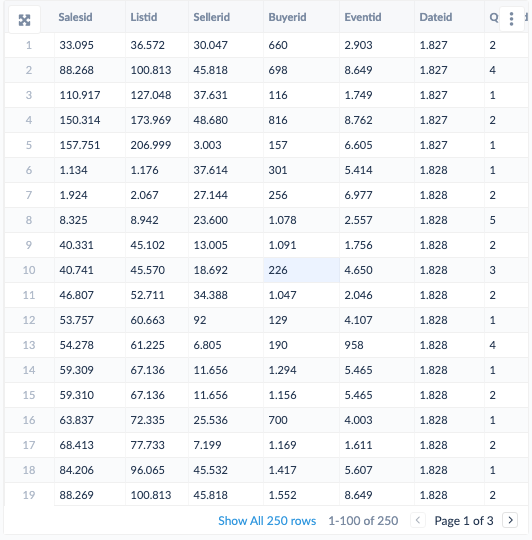
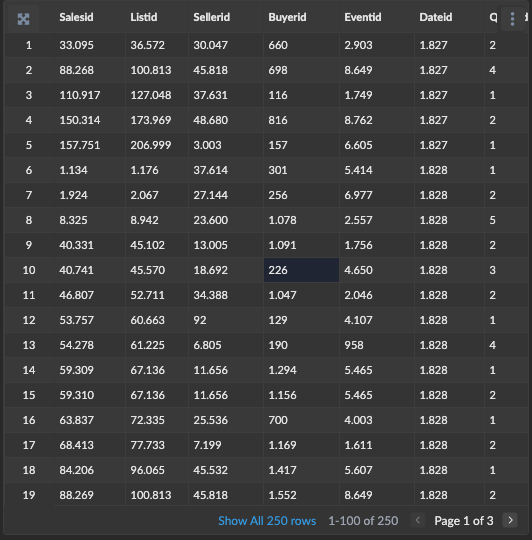
The paging behavior is configured in the visual configuration bar above the chart preview in the report editor, alongside the table size and the other display options:


-
Rows per page: Choose how many rows each page shows — 25, 50, 100, 250 or 500.
-
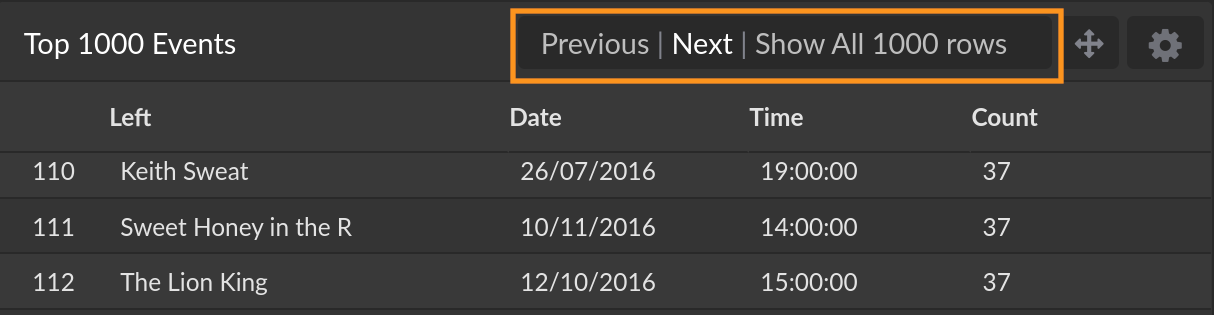
Legacy paging: Restores the previous paging style, where the
Next/Previouslinks andShow All xxx rowsappear in a bar at the top-right of the chart on hover, instead of in the bottom footer. Legacy paging always shows 100 rows per page, soRows per pageis disabled while it is selected.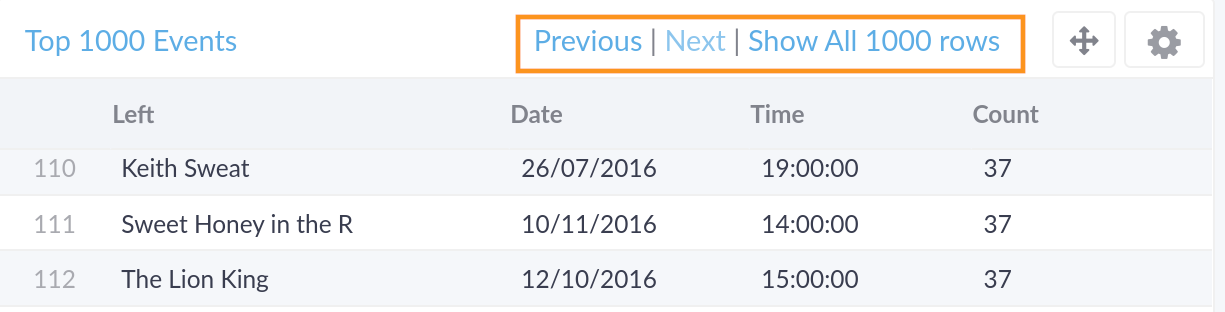
 note
noteTable charts created before the paging footer was introduced keep legacy paging by default, so existing dashboards are unchanged. New table charts use the paging footer.
These options are also available for the legacy Pivot / Cohort Table chart.
Automatic Links
Columns formatted as Text automatically detect URLs in their values and render them as clickable links that open in a new browser tab.


- Plain URLs: A value containing
http://,https://or amailto:address becomes a link, e.g.https://cluvio.comormailto:support@cluvio.com. URLs are detected anywhere within the text, so a cell can mix regular text with one or more links. - Custom link text: Use the Markdown-style syntax
[label](url)to show your own text instead of the raw address, e.g.[Open ticket](https://example.com/tickets/42).
The scheme is required — http://, https:// or mailto: must be present.
Bare domains such as cluvio.com and www. prefixes are not linked.
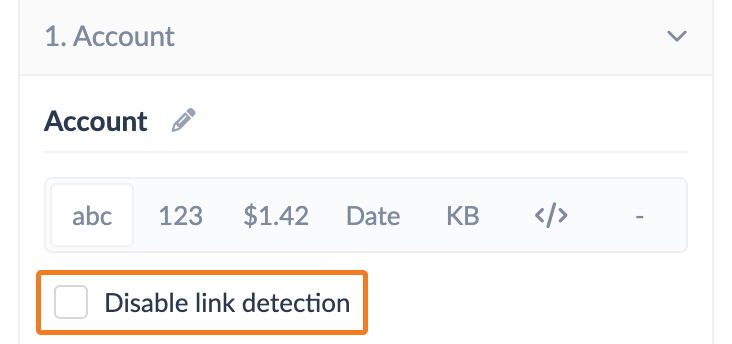
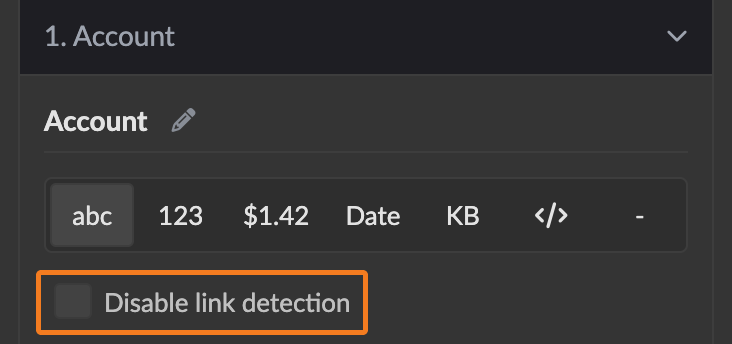
Link detection is on by default. To switch it off for a column, enable Disable link detection in the column's Text formatting options (see Column Formatting). It does not apply to columns that have a drill-down configured (the drill-down action takes precedence), or to columns using the HTML format, where you provide the markup yourself.
Configuration
The following visual configuration options are available:


-
S, M, L, XL: Preset sizes for the table content.
-
Rows per page: How many rows each page shows. See Paging.
-
Legacy paging: Show the paging controls in a bar at the top of the chart instead of in the footer. See Paging.
-
Column Headers: Whether column headers should be shown.
-
Row Numbers: Whether row numbers should be shown.
-
Human Column Headers: Whether column headers, which originate from the query result column names, should use human-friendly capitalization.
-
Column Totals: Whether to show column totals for numeric columns. The totals are always visible at the bottom of the chart and are always computed for the full data set, even if it is distributed over multiple pages.
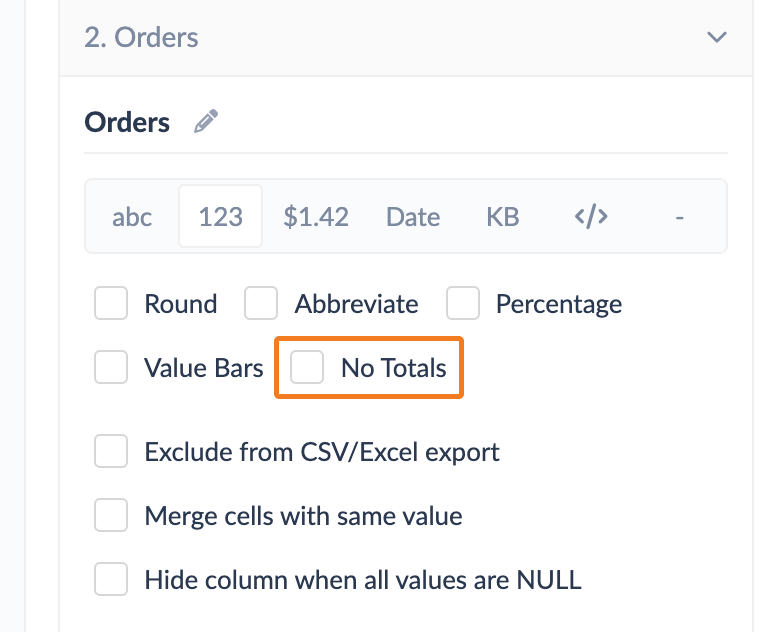
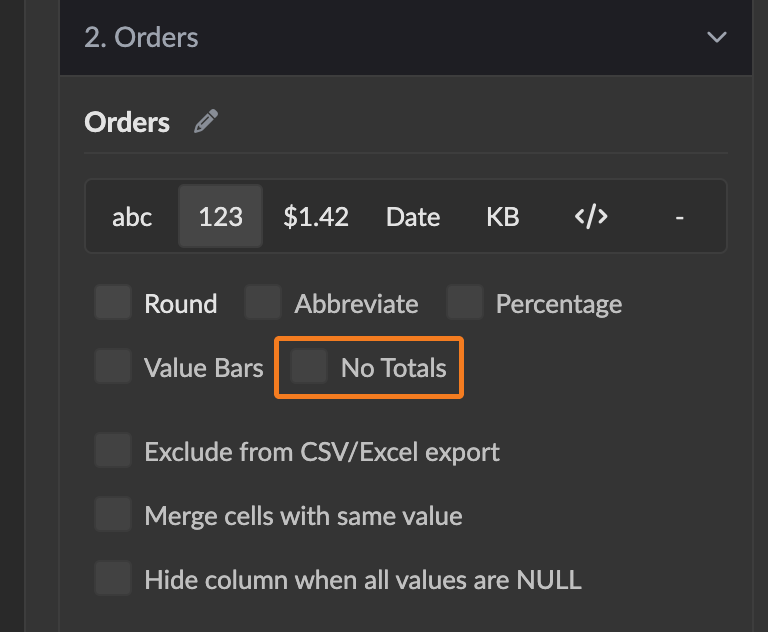
Hiding Some Column TotalsIf your result data contains one or more numerical columns for which a total is semantically not meaningful (e.g. database IDs), configure the column with
No Totals. See Column Formatting. -
Auto Column Width: Whether column width should be automatically adjusted to fit the content as best as possible.
-
Freeze Columns: Keep the leftmost columns in place while the table is scrolled horizontally. Selecting it reveals a dropdown for how many columns to freeze. Available when the result has more than one column.
Column Formatting
To configure the formatting of individual table columns, select the Columns
tab in the report editor's table chart configuration. For each column, select a
formatting style that is suitable for the values (the default selection is made
by Cluvio based on the column data type).
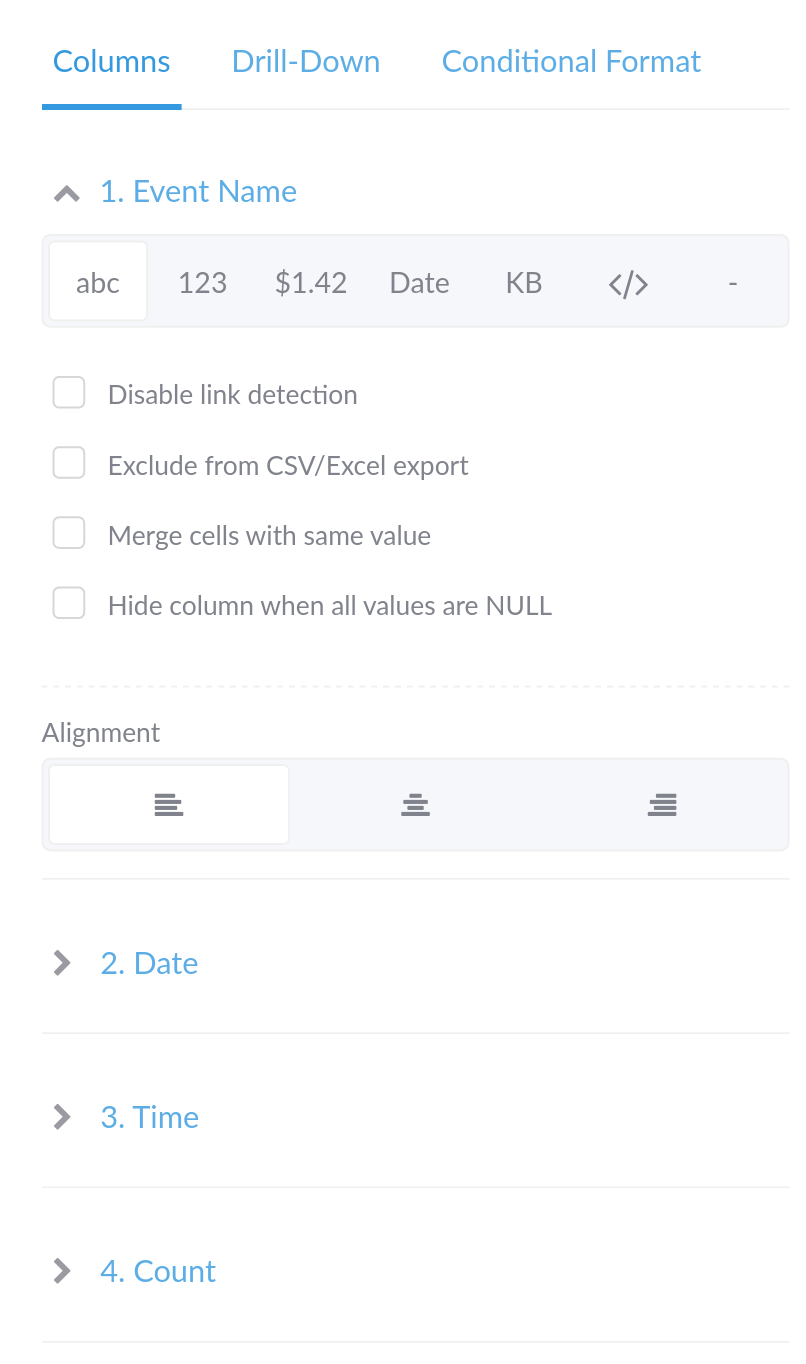
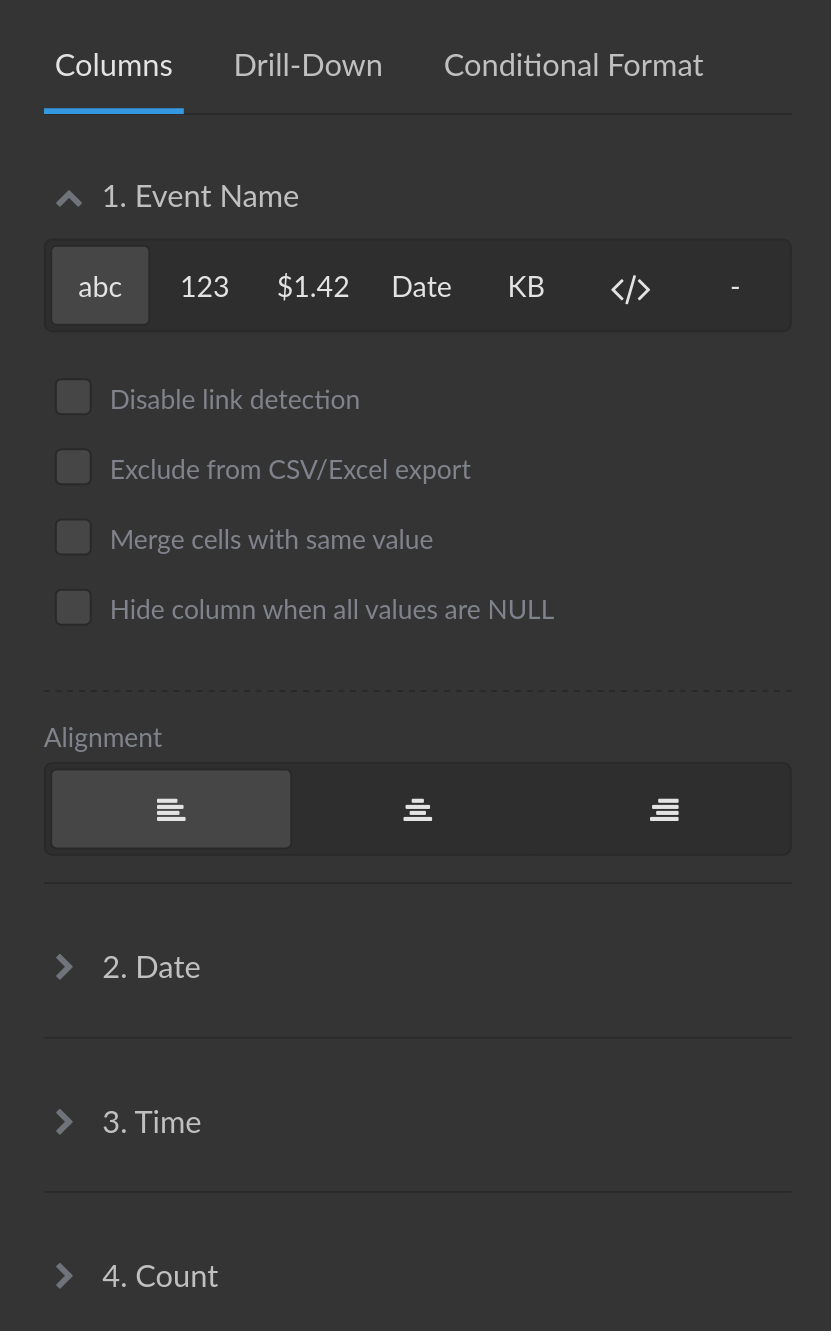
The additional formatting options available for a column depend on the selected
format style and the table format configuration. For example, if Column Totals
are enabled for the table, a No Totals option becomes available for numerical
columns.
Drill-Down
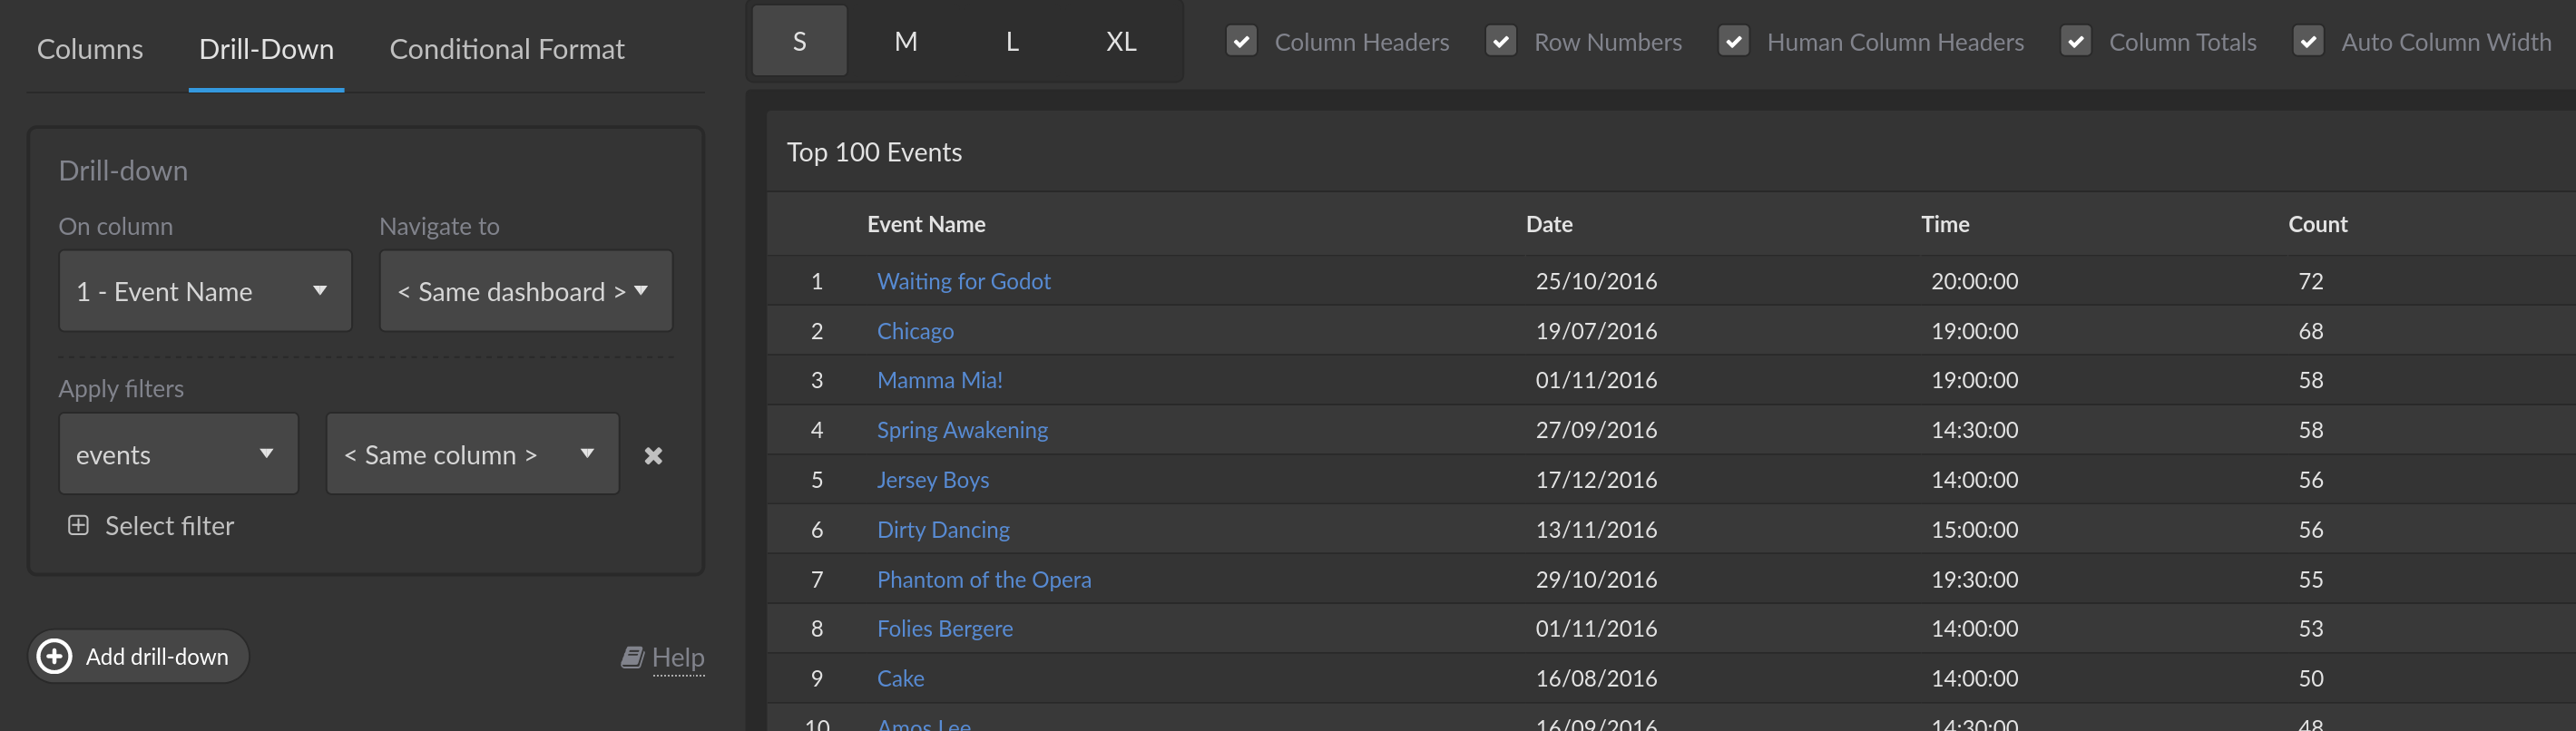
The drill-down configuration can be used to make table cells interactive,
such that clicking on a cell applies a filter value (typically the value shown
in the cell). For example, in the below configuration, a drill-down action was
added to the Event Name column, such that selecting an event name will apply
that name to the events filter (used by other reports on the same dashboard).

Conditional Formatting
Conditional formatting allows configuring a set of rules for columns that apply text and background formatting based on a cell's value.

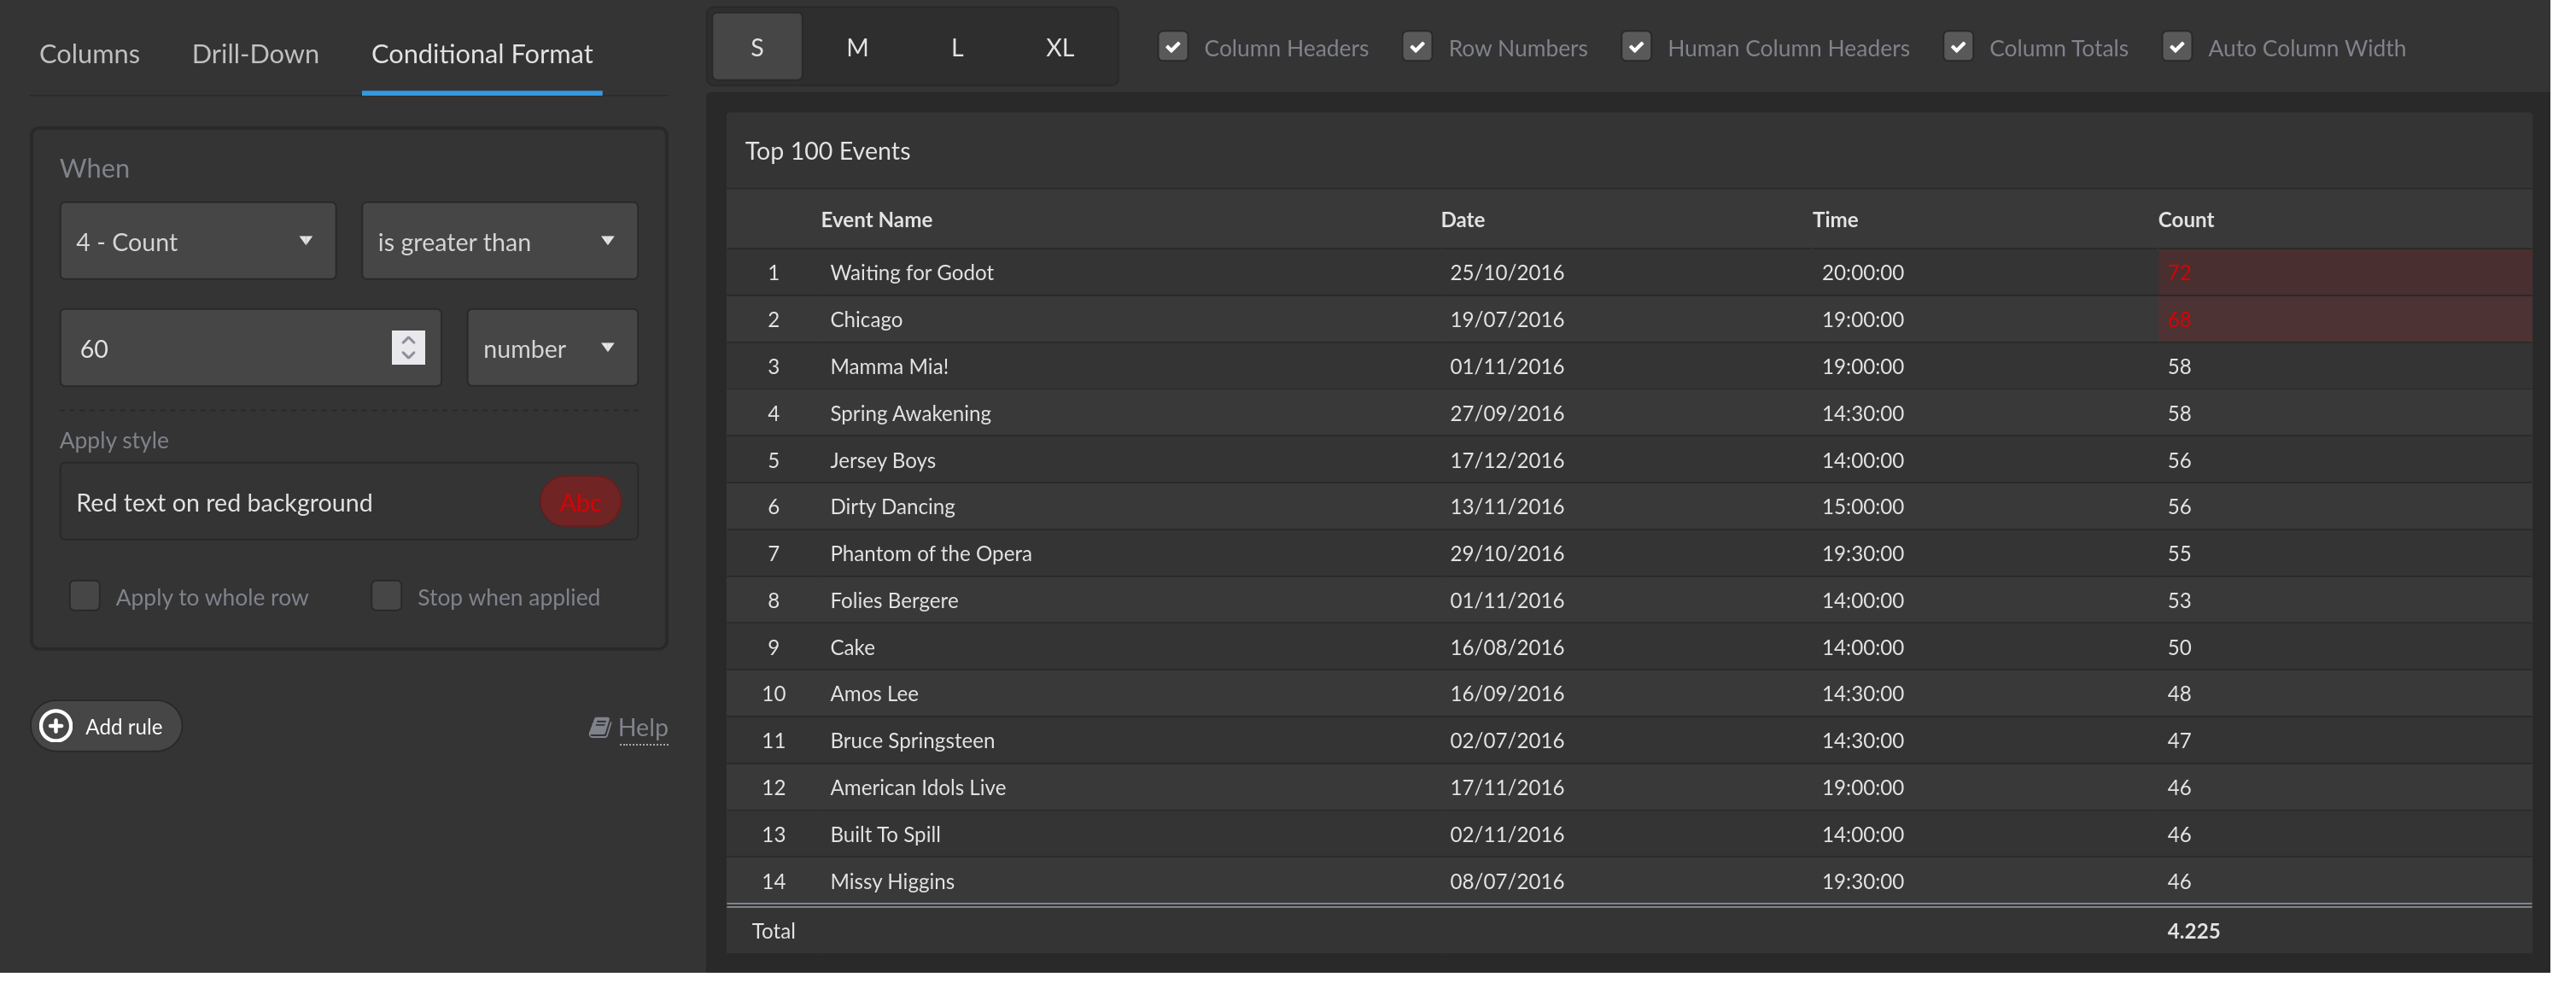
Even though any custom formatting can also be done via embedded HTML, conditional formatting makes it easier to define the formatting rules and has the benefit of keeping the raw result value free of markup, e.g. for a clean export to CSV/Excel and to retain correct sorting behavior for numerical data and prevent possible HTML injection when using HTML formatting with unsanitized result data originating from user input.